12 Oct 2023. See also Sam’s The Lessons of Fin for This Generation of AI Assistants retro.
From 2015 to 2019, I worked at Fin, where we were building what I would describe as “Uber for executive assistants.” The idea was that an EA can be incredibly valuable, but typically you only get access to this service if you can hire someone full time (40h / wk)
We thought it would be a long way before “AI” could deliver such a service, so we hired a team of people, built them powerful tools for managing a knowledge graph with all the essential details you need about someone if you’re gonna be their assistant, and gave anyone access under a “per per minute” pricing model.
Our team of assistants was incredibly efficient and the service was really delightful to use, but the business did not grow quickly enough to fulfill venture returns. The main problem was that even if you’re very efficient, it takes longer to do an even seemingly simple task – make a restaurant reservation or schedule a meeting for a few people – than you think.
Since the release of ChatGPT, several people have sent me questions about the Fin Assistant service (as they are planning to build a new and similar type of service on top of GPT-x).
This would be great and I hope someone makes it happen, because I miss the Fin Assistant!
I have started posting the questions and answers here – along with a full archive of the old fin.com blog – for anyone working on something like this to make use of.
If you have a question that is not answered here, submit it to this Google Form and if I know the answer I’ll add it to this page.
- FAQ
- fin slide archives
- Sam’s Retro
- fin blog archives
- Introducing Fin // 17 Aug 2015
- The Fin Exploration Company Charter // 10 Sep 2015
- On Bots, Conversation Apps, and Fin // 21 Jan 2016
- AI and AAI // 28 Jan 2016
- Everything I Have Learned about Making Engineering Performance Reviews Efficient, Effective, and Fun // 23 Oct 2017
- Building Hybrid Intelligence Systems - 2017 Fin Annual Letter // 20 Nov 2017
- 1. Shared memory tools make teams smarter and better than any individual can be alone.
- 2. Checklists help even the best humans get things right.
- 3. Using personal context to do the ‘right’ thing for each customer is table stakes for doing work as high quality as a human assistant would.
- 4. Leverage data to reduce variance in human systems.
- 5. Computers are better at math than humans.
- 6. Humans are the universal API.
- 7. Closing thoughts: hybrid intelligence systems should outperform pure software and isolated individual humans.
- Intelligent Work Routing, Dedicated Account Managers, and New Feedback Channels // 13 Feb 2018
- Improving Operations Quality through Measurement and Performance Management // 15 Apr 2018
- Finding the Right Person for the Job: Matching Requests of Different Types to Workers with Different Skills // 12 Jun 2018
- Fin has gotten dramatically higher quality and lower cost over the past few months // 18 Jun 2018
- Identifying Feature Launch Dates Using Gini Impurity // 07 Jul 2018
- 2018 Fin Annual Letter // 31 Oct 2018
- Measuring Work-Mixture Changes using Jensen Shannon Divergence // 04 Nov 2018
- Fin’s Plan for 2019 // 18 Dec 2018
- Talking Fin Analytics with Harry Stebbings // 04 Feb 2019
- AAI 2018 Conference // 05 Feb 2019
- Why You Need to Invest in Analytics Before You Invest in RPA // 24 Feb 2019
- CX and Ops Teams Need Full Funnel Metrics // 18 Mar 2019
- Creating Metrics for Diverse Workstreams // 26 Mar 2019
- Driving Success Metrics with an Operations Flywheel // 16 Apr 2019
- Agent Metrics Overload: Scorecards, Focus Sprints, and All-Stars // 06 May 2019
- Get the Rest of Your Org on the ‘Front Lines’ with Your CX Agents // 13 May 2019
- Increase Team Productivity with Comprehensive Process Data // 23 Jul 2019
- How to Choose CX Metrics that Drive Real Business Outcomes // 25 Sep 2019
- How to Organize Operational Data for Maximal Insights // 03 Oct 2019
- Identify and Prioritize Opportunities for Workflow Improvements // 14 Oct 2019
- AAI 2019 Conference // 01 Nov 2019
- Opening Remarks: AAI Year In Review
- The State of Knowledge Labor
- The State of Operations Tools
- RPA and Automation
- Next Generation End-User Services
- The Startup Path to the Future vs. Enterprise Modernization
- Measurement and Optimization Strategies
- Fireside Chat: Amar Kendale & Jessica Lessin
- QA strategies & debugging people, process, and tools in AAI systems
- Handling Ticket Outliers in Operational Settings // 06 Nov 2019
- Discovering Best Practices From Your Team // 12 Dec 2019
- Benchmarks and Approaches for Managing Team Engagement // 12 Dec 2019
- Can’t find an answer?
FAQ
Why did Fin shut down?
Although our team was very efficient, it was still more expensive than most customers wanted. I imagine you could do something far cheaper and maybe slightly less capable using gpt4 plugins these days and maybe find a market.
You would certainly get me as a customer if you built a great assistant today!
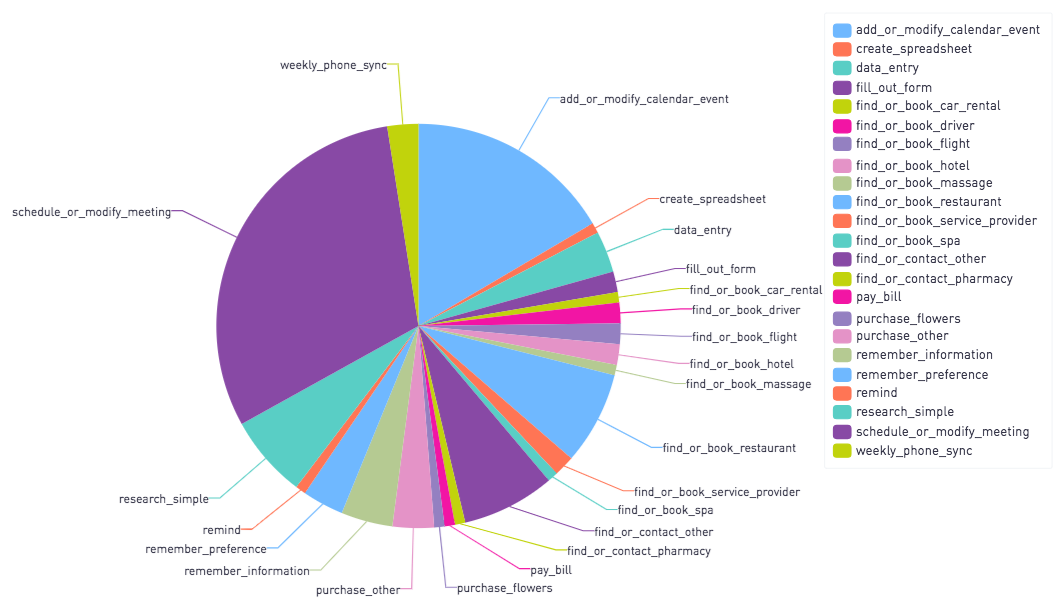
What kinds of things did people ask Fin to do?
I dug up this “Workflow Fingerprint” for a user that shows the major categories and subcategories of tasks we performed:
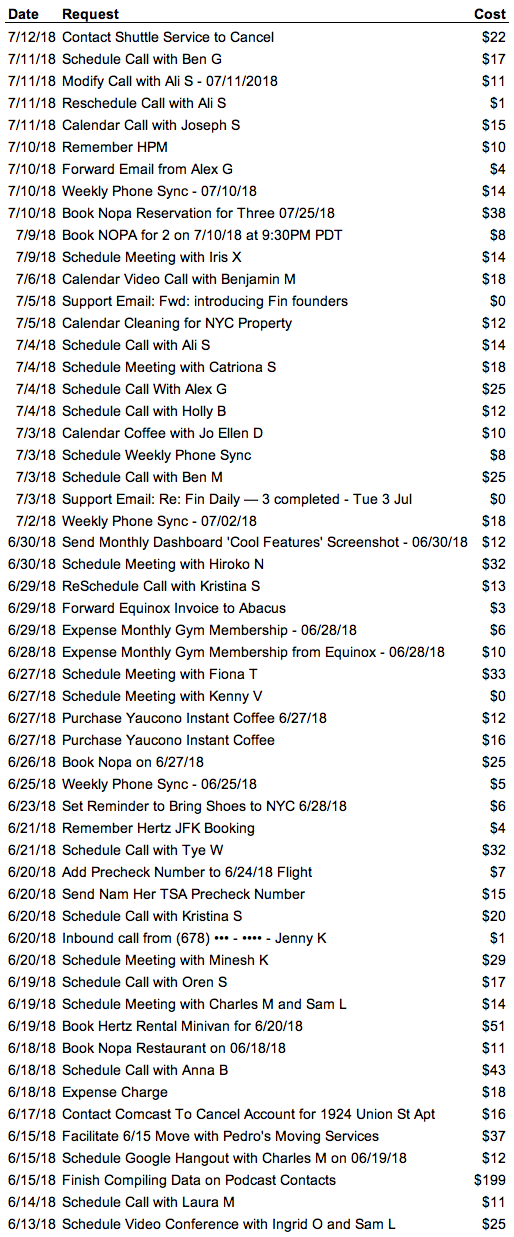
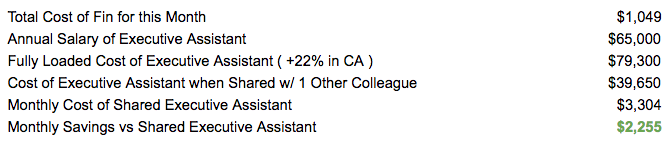
How much did tasks cost?
Here are some screenshots I found from 2018:
How were you able to get customers to share sensitive information with you?
The more you trust an assistant with sensitive information, the more they can do for you / the more time they can save you, eg:
- they need read / write access to manage your calendar
- they need your credit card number to buy things for you
- they need your home address to have things shipped to you
- they may need a photo your drivers license or passport to book cars or tips for you
- etc, etc, etc
Very few people started by granting full access. They would typically start out with tasks requiring less sensitive information, eventually ask for something that required more sensitive information, and at this point if the task was valuable enough to them and they trusted us they would provide the necessary sensitive info.
What kind of tools did you build?
One of the main challenges in trying to enable a team of people to operate AS IF THEY SHARE A BRAIN is context maintenance.
For example, when you tell your human assistant, “I always try to schedule a 15 minute buffer between calls but a 30 minute buffer between in person meetings – and obviously account for travel time…”
This is relatively easy for one person to track, much harder to store in a structured way and present ONLY WHEN NECESSARY – because for any given person, they eventually have hundreds of nuanced preferences and you cannot expect an assistant servicing a request for them for the first time to read through every single one of them!
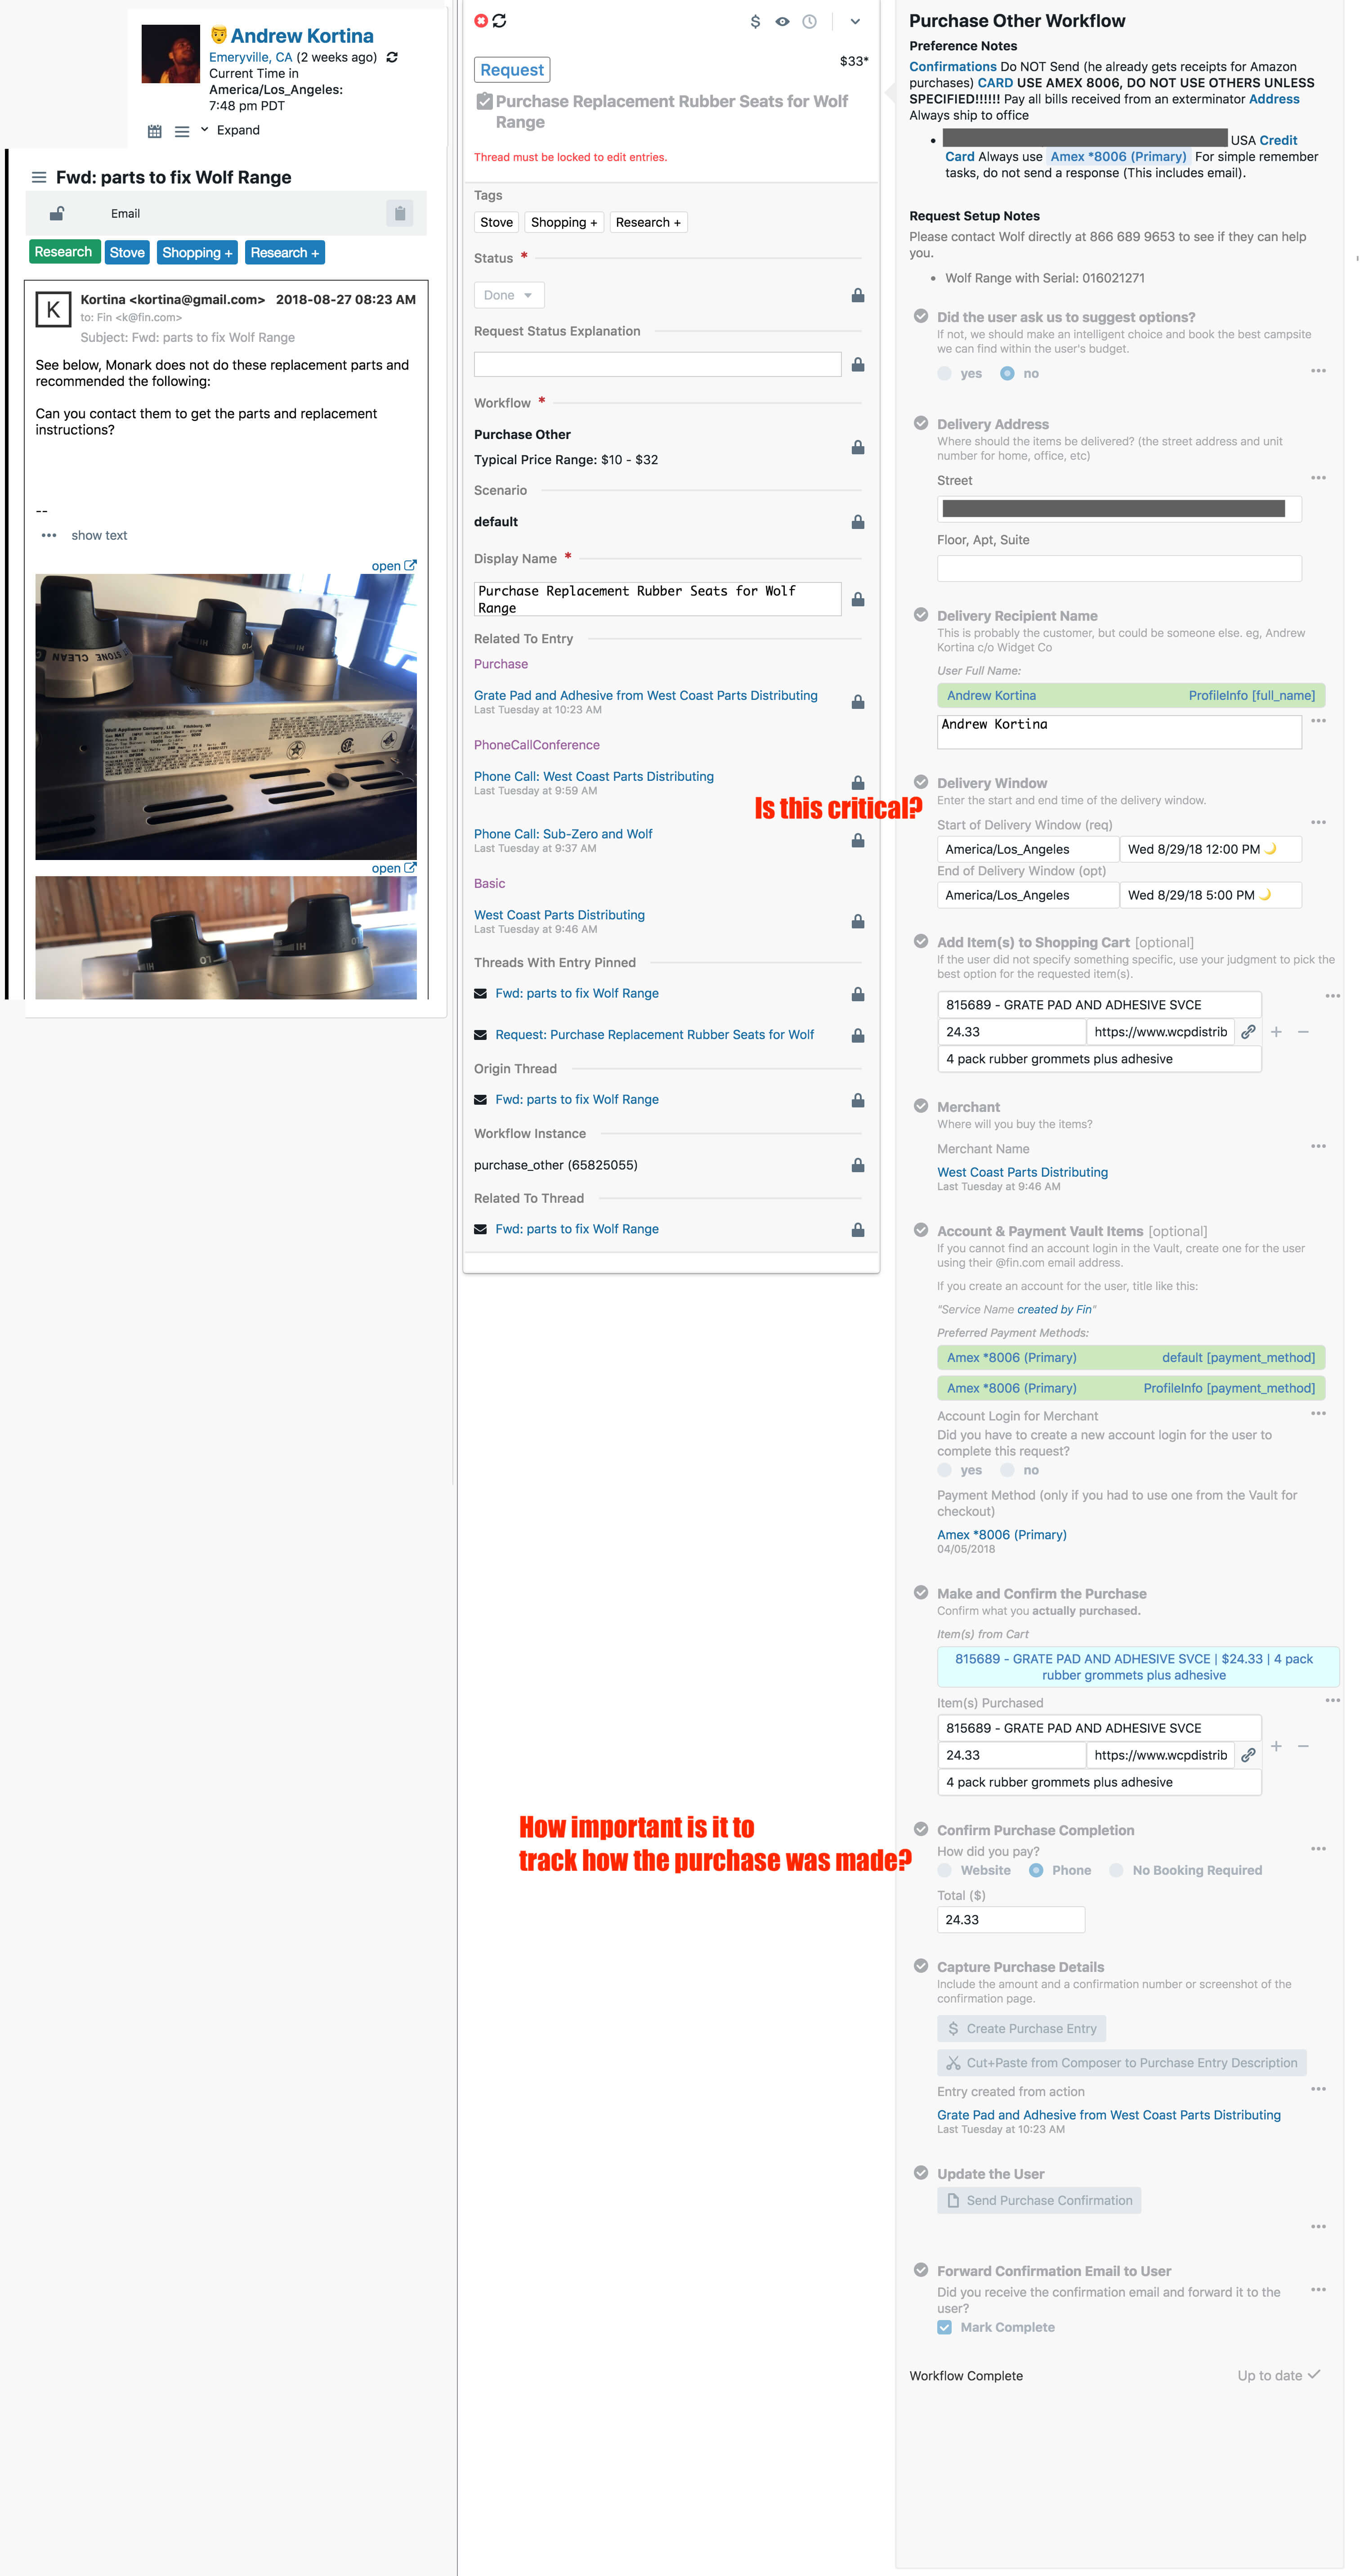
Here are some screenshots of dashboards we built and workflows to create structured data and then output it into templates for communicating with customers.
Notes on this one:
- the “Typical Price Range: $10 - $32” was computed based on all the attributes of this request and a machine learning model we called “price book” and showed to customer to help them anticipate the cost of a task
- addresses, geo coordinates, calendar events, payment methods – all of this was structured and saved in the graph (and if sensitive, stored in a “Vault” – whenever an agent accessed an item in the Vault, it was audit logged so customers could review access to sensitive data)
- all these form fields had type-ahead auto-completions
- the red text is product feedback for the team of agents managing workflows
- you can see, a lot of the structured data is geared towards helping human agents transmit context to one another
Here is the workflow for scheduling or modifying a meeting (lumped into a single workflow because they are almost identical tasks).
Note there were deep integrations into the calendar to automate the placing and removing of “HOLD” events on the user calendar to prevent double bookings:
Another workflow to find or book a driver:
Here is an example of the tool our best agents used to build “workflows” – forms that encapsulated the best practices for each type of task and were able to output structured data into templates:
fin slide archives
Here are a few slide shows I dug up:
- Fin World Tour 2017: A System and Method for Performing Heterogeneous Knowledge Work
- Fin Analytics
- The Operational Flywheel: The Science of Continuous Improvement for CX Metrics
Sam’s Retro
fin blog archives
Introducing Fin // 17 Aug 2015
A few months ago, the two of us started exploring an idea: “Mobile devices are extremely powerful, but apps are a crude method of interaction. In sci fi, people just talk to machines like they talk to people. That is the future.”
We don’t want to wait for the future. We want something like the OS from Her today. To this end, we’ve started The Fin Exploration Company, with a small team of wonderful people.
When we started, our goal was to remove friction and tedious tasks from our lives. But what has emerged from our prototype is more than this.
After interacting with Fin for a few weeks, I’ve been surprised to find that it does not feel like software. Fin feels like a person — actually, it feels like a multiplicity of people, almost like a city…
Fin grows and learns. Fin has an opinion. Fin surprises me and challenges me. Talking to Fin is a real conversation, not just a query and response or command dispatch.
If developing this kind of intelligent entity excites you, email us. We are hiring engineers and are always looking for new teammates who share our grit, curiosity, and voracious appetite for life.
– Sam and Kortina
The Fin Exploration Company Charter // 10 Sep 2015
We believe that people will someday interact seamlessly with the universe of information and services through natural speech assisted by an “agent” that knows everything about us. The final interface is no interface. This is not a novel vision; it is one that has persisted through generations of science fiction. Many organizations are currently working on the deep problems that should eventually - given enough time and effort - deliver this future.
We don’t want to wait.
Fin (The Fin Exploration Company) has the charter to sail due west from port San Francisco with a small veteran crew seeking a shorter route to the end game of technology. Our mission is to determine if we can build a valuable and useful service in 2015 that models and can eventually develop into the “end”.
We will get to market this year by releasing three key constraints:
-
First, in due time, we believe that this service will be primarily delivered by AI. But to make this possible today, we believe in primarily leveraging the most powerful intelligence currently known. People.
-
Second, following from that, we believe that this service will eventually be available to everyone at zero cost. But to make it possible today we believe in starting with an expensive subscription product that will initially only be available to the few, not the many.
-
Third, in due time we believe that this service will be able to efficiently interface with the marketplace of all the other services in the world, to provide for people on-demand and seamless real world goods, products and services; however, the first step in the journey will be fully focused on determining if a stand-alone information service will provide enough value to justify the expense of providing the service today.
We intend to be rigid and dogmatic on two key points:
-
We will not divert course from a path that we believe leads to the end game. As we sail we will likely make discoveries that will speed our journey, which we will embrace wholeheartedly. What we will not do is compromise on the mission or divert course for safe harbors we may find along the way. We may evolve our charted course, but we do not believe in pivots. This means we will always bias towards how we expect AI will work at scale, and bias away from application specific user interface.
-
We do not believe in negative gross margins or inflection points. Over time technology can improve the quality of service and margins, but there are no magic corners in great services or businesses where zeros become ones. Therefore, as we sail we will not subsidize the actual cost of service to users. We believe that without the rigor of gross margin, it is too easy to lose your way.
We believe in a specific form of navigation:
The most important part of any expedition is how you choose to navigate and therefore measure your progress. Our core belief is that any product that does not have consistent daily use is destined to ultimately fail. Thus, we intend to optimize in this first expedition for daily users and daily use, measured in terms of writes per paid subscriber.
For us to consider this exploration to be successful we need a small set of people to be paid subscribers who use the product at least 5 days a week, with a positive curve on the number of uses per day. To be sure, the key is to achieve these metrics on our specific product and vision, not just any product.
If we can achieve that end, we will be confident that we are on the right course. If not then we will be skeptical. Because we will not broadly launch, we expect to be the first two daily users and expect the remainder of the set to be in New York and San Francisco and likely be our friends and friends-of-friends. We are not looking for broad user adoption or appeal; we are looking for real and measurable use from a small set of people, not just intellectual lip-service.
That said, while we have a clear sense of where we want to go and what metrics to watch, we will be leading day-to-day by feel and our own sense of dead reckoning based on our collective product experience. We will be observing how people behave/act as opposed to overly reacting to opinions people verbalize.
Columbus spent years arguing for and training for his first mission to try to find a shorter route to Asia. He sailed without seeing land for just 29 days. The actual expedition that found the new world was just 29 days long. This is the model we intend to follow. A carefully planned sprint, not a marathon.
In this respect we expect that this initial charter will be quite short-lived. If we sail for a few months and find something very special, then we will evolve into a development company rather than an exploration company and devote decades to building a product that will hopefully eventually deliver the future to millions… But what we are staffing and financing today is a crazy, very high risk, expensive expedition, not the hard work of development.
We are confident in our vision and strategy, but we sincerely acknowledge that we will likely fail, and want to impress on all those that embark on this journey with us a simultaneous sense of confidence and expectation of complete failure. We can make strong arguments to ourselves that the time has come for this expedition, but we also are fully aware that those that have come before us and failed held similar perspectives. If we are unable to find what we are looking for, we will regroup, put together another expedition, and sail again.
– Sam
On Bots, Conversation Apps, and Fin // 21 Jan 2016
2016 is being declared the year of bots. And it feels like there is a broad shift in the developer ecosystem away from traditional point-and-click apps, towards chat-based user interfaces.
It’s happening because there is broad consumer and developer fatigue with apps. Consumers don’t want to install or use new traditional apps. And partially as a result, developers are faced with rising distribution costs.
At the same time, the American platform companies are preparing for a new post-app battleground modeled after the Asian messaging services. Companies like Slack are looking at chat-as-platform as a major next step. Facebook is banking on its messaging properties (Messenger and WhatsApp) to get back into the app platform game.
The many-billion-dollar question, however, is whether the transition to bots and conversational interfaces will represent a major point of disruption or more of an evolution in the interface paradigm.
In the last few decades we have seen several moments of big platform turnover. There was the move from shrink-wrapped software on desktops dominated by Microsoft to the free-for-all of the Web. Then there was the move from the Web to the app world dominated by Apple and Google. And now we are at the start of the move from apps to bots and conversations.
The bet I am making, both as an investor and operator, is that the 2016 bot paradigm shift is going to be far more disruptive and interesting than the last decade’s move from Web to mobile apps, though perhaps not as important as the move from shrink wrap to Web.
The Last Big Shift: 2008
In 2008 Apple opened up the app store and began to usher in the move away from the Web and back towards client software in the form of downloadable apps.
Developers had to deal with new languages, new approval processes and to remember how to deal with all the cost and complexity of developing and maintaining client software.
But it was clearly worth the move.
Phones expanded the market for developers by increasing the reachable population of people online and expanding the time each person was spending connected. At the same time, new payment options made it possible for developers to monetize better than they could before.
There was a gold rush. Categories like casual games, which could monetize the new platform quickly and efficiently, grew rapidly. The disruption also allowed several companies, like Instagram and Snapchat, to wedge into valuable positions against Web incumbents.
That rush, however, was relatively short lived, and many if not most of the high-flying app first companies have been wiped out. Today, the list of dominant players doesn’t look all that different from the way it looked pre-app. Facebook, Google, and Amazon dominate their respective verticals — communication, search, and commerce — just as they had at lower-total-scale pre-app.
Over time the legacy of the app rush is likely to be enabling on-demand services like Uber and Postmates by making it easy to manage a distributed geo-located workforce, more than fundamentally changing the dynamics around how people spend their time and money.
The app era certainly enabled some new awesome services. But when you step back for a moment it really didn’t change the fundamental landscape of communication, search, entertainment, or commerce very much. It just increased the reach and depth of the incumbents.
The Next Big Shift: 2016
If the app shift moved developers away from server side development and towards clients, the most important part of the current shift is a move back towards the server and away from client software in the form of bots.
Practically this means that services are being developed in one of two ways. The first is with no client-side software, using things like text-messaging today, and perhaps Facebook and Slack tomorrow, as the user-facing front end. Or, short of that, with very lightweight and simple apps connected to much deeper server-side services.
There are several advantages to this shift. First, and I don’t say this lightly, dealing with installed client software is slow. You have multiple versions of the same software running on different devices, and you have to ship software that cannot be easily recalled for bugs or errors. Startups have a hard time winning at the game (as I have written about before). The bot paradigm is going to allow developers to move fast again.
Second, while phones have certainly gotten more powerful and have more storage than ever before, they’re toys compared to what you can do server side with massive data and processing power. This is a big part of the reason that so many so-called AI companies are springing up. They will be the arms dealers to bot developers.
Third, services with bots on the front end can, in theory, be far more personal than apps. Apps that are downloaded and installed are broadly the same for all users. Sure, the content inside the app might be personal, but the layout, functionality, and context of remotely installed software is very hard to customize for each user. Bots are different. In theory they are infinitely more personalizable because you aren’t moving interface around, you are customizing content and service.
At the same time, it isn’t all gravy for developers in bot-land.
First, the fact that bots aren’t installed so much as messaged is a double-edged sword for developers.
Taking away the installation step makes it much easier to quickly start using a bot versus the heavy install process on apps. This will reduce the friction in getting users to try new things.
The negative part is that with apps, if a developer makes it onto a user’s home screen, they can develop a direct relationship with the user. Bots have a much harder time getting to that point to the extent they sit on top of messengers and can’t occupy as prominent screen real estate.
Second, the platform business-dynamics around bots is yet to be determined. The specific rules that get set for bots will matter a great deal in defining whether they become a vibrant ecosystem or a failed backwater.
There are two possible extremes to this. On one hand, companies like Slack and Facebook could decide to play kingmaker in various verticals, just as their Asian messaging counterparts have done. Doing this could drive more profit directly to the platforms and might actually provide better, more deeply-integrated services. But it would also kneecap a lot of innovation.
The other extreme would be a bot-free-for-all, which would lead to a lot of innovation, but also probably a lot of user issues around quality of service and privacy.
The likely outcome is almost certainly somewhere in the middle. The platform companies have too much history and experience to make the mistakes of either extreme. But the reliance of developers on single platforms and the ability of those platforms to change the rules and distribution characteristics for apps will leave developers on edge for the foreseeable future.
Fin.
There are people that like to talk about the bot space, or the “conversational app” space. I think this is ridiculous. Bots or conversational apps is not a “space.” It is a broad paradigm which describes a direction that developers are moving in.
There are conversational apps that are focused on shopping. They will compete with Amazon and other commerce platforms that will, in time, move towards the conversational space when it becomes important to their business.
There are conversational apps that are focused on travel, helping you figure out where to go, how to get there, where to stay and what to do. They will compete with Travelocity and Tripadvisor, and even Airbnb, which will build their own conversation interfaces too.
There will also be conversational apps focused on entertainment, news, and basically every other vertical that currently exists in the app store.
I’m part of a small group working on a conversational agent. It is called Fin, and it is in the search and information space.
We use a combination of machine and human intelligence to find answers, send messages and remember everything for you.
You use it like Siri, Echo, or Google Now. But because we use people, Fin gives you an answer every time rather than occasionally, and can handle natural human requests that go beyond simple facts.
Are we competing for the entire conversational market? Of course not. We do, however, think that we can make some core experiences you have every day dramatically better.
Conclusion
I hate buying into hype. I would love to say that all of the chatter and attention around conversational experiences and bots is just PR crap.
I don’t think it is. I think it is a fundamental shift that is going to change the types of applications that get developed and the style of service development in the valley, again.
In general, I am very excited. In the optimistic case I think that bots will open up better services for users faster and disrupt some very large entrenched players in a way that the app paradigm never did.
What remains to be seen is not who wins the conversational app space, which is an irrelevantly broad concept but, rather, which big incumbents seamlessly navigate this next shift, and which get taken out by new nimbler developers working in a new way, with new tools.
– Sam
AI and AAI // 28 Jan 2016
The paradigm shift towards conversational / bot interfaces in response to consumer app fatigue has been accompanied by a lot of buzz about “AI.”
All of this buzz (somewhat disappointingly) is just a conflation of the chat interface with “AI” due to the central role that conversation plays in the Turing test for machine intelligence — it’s not the result of any breakthroughs in general intelligence / deep learning that would enable new consumer applications. The exciting “AI” action is still in the realm of research labs like Vicarious or Google’s Inceptionism (perhaps an early version of “computer thought”?).
If we already had AI in the strong sense, Siri (and similar products) would be good. Today, however, Siri et al can really only perform narrow tasks like setting reminders, checking the weather, and dialing phone numbers (and they only get it right about half of the time).
The result is a tantalizing glimpse of the AI powered interface from all the sci-fi (Samantha from Her, HAL from 2001: A Space Odyssey, Jarvis from Ironman), that makes us yearn for this awesome style of interaction even more.
At Fin, we’re tired of waiting for “AI” / software to deliver on the future, so we’re trying to build it with “AAI” — artificial artificial intelligence. We will combine the best of both software and human intelligence to get the results we want — namely, a system that functions like the AI powered ones from sci-fi.
We’re less concerned with modeling pure software algorithms after individual brains, and we look instead to biological models at the species or ecosystem level, where we observe diverse sets of creatures participating symbiotically in a system that exhibits probabilistic tendencies.
With this in mind, we try to design all of the hybrid systems powering Fin to have feedback loops that ensure subsequent interactions tend to be better and better over time (just as we observe systems like evolution of species and survival of the fittest within species trend towards this in nature). This means that when we talk about “AI” at Fin, we don’t mean “artificial intelligence,” but “always improving.”
The practical upshot of our bastardized interpretation of “AI” is a service that delivers human level intelligence and understanding to our users today and over time is constantly learning more about them and getting faster and cheaper as our software systems grow more sophisticated.
If you’re interested in this framework for designing intelligent systems, drop us a line.
– Sam and Kortina
Everything I Have Learned about Making Engineering Performance Reviews Efficient, Effective, and Fun // 23 Oct 2017
When I ran our first performance review cycle for about a dozen engineers a little over a year ago, I had never participated in an official performance review myself, either as a manager or a report.
I was a bit skeptical that the whole thing might be a bunch of corporate bureaucracy, only necessary at large companies for incentivizing armies of employees with invented ladders of meaning.
I wondered why all feedback could not just be in realtime, ad hoc, based on performance wins and successes as they happen.
I was also a bit daunted by having to write reviews for over a dozen people.
Having run several of these now, however, I have come to really value and enjoy our review cycles, and I wanted to write up everything I’ve learned about the process along the way.
TOC (since this is a very long post):
- Getting Started
- The Basic Components
- Upward Review
- Self Review
- Peer Reviews
- Manager Review / Compilation
- Grouping and Summarizing Direct Quotes from Peers
- Commentary on Key Themes and Strategies for Future Growth
- Review Summary and Compensation
- Delivering Reviews
- Final Thoughts
Getting Started
When we spun up our first review cycle, having never done one before, I did what I usually do when I’m in a role doing something new: I interviewed some people who had done this before.
The two people I interviewed were Raylene Yung, an engineering lead @ Stripe (formerly @ Facebook, and also an advisor to Fin), and my co-founder, Sam, who had lots of experience with performance review cycles when he led a large product org at Facebook.
Btw, if you’re an engineering manager, I highly recommend checking out Step 4: Edit and iterate on your outline of Raylene’s post on how she runs performance review cycles. There are some great tips in there for making the review more focused.
Input from Raylene and Sam led to most of the shape of our current engineering review process at Fin.
The Basic Components
Our review cycle for each employee consists of the following:
- a review of your manager
- a self review
- 3 peer reviews
- a review from your manager
We use Google Forms to collect all of the reviews.
#protip Google Forms doesn’t reliably save your progress, so better to write your reviews in a doc and paste the answers into a form, rather than write a long review in Google Forms directly and risk losing your work.
Upward Review
The manager review consists of the following questions:
What did this person do well?
What could this person be doing better?
These are the most open ended of all our review prompts, leaving room for people to give feedback of any kind.
Here’s an example of some good upwards feedback:
Sometimes I wish I understood the process by which certain decisions were reached. In all-hands meetings, I’ve always walked away impressed by how clear and thoroughly reasoned objectives and goals are (i.e., I know why we have that objective and how we chose it vs. others). I don’t always feel this way in more micro-objectives or sometimes I feel that we choose to just “do it all” instead of picking specific things to focus on.
Self Review
The self review consists of the following questions:
Looking back over the last few months, what are you most proud of?
What do you think are your biggest areas of opportunity to grow? What are you hoping to achieve in the next quarter both in your role and as a team member?
Examples of some good answers to the first question:
ML Tagging & the docker pattern for this service: It forced me to learn the infrastructure more and productionalized a tool on a new stack (python), with tests, with a new AWS setup, and more cross-pollination with analytics. Buttoning it up to a point where analytics can build off it, beefing it up with tests, and making it “learn” from new data over time was very very fun.
Or:
We created an environment that was supportive, challenging, and fun, and carved out projects that interns were genuinely interested & excited in — and we will have a very high offer:intern ratio! I applied our learnings from last summer’s intern program and took on a diffuse set of responsibilities that included the coordination of onboarding efforts, guiding interns on project selection & scoping, reviewing PRs, organizing performance reviews, organizing meetings / office hours, and scheduling events (with lots of help from Laura and awesome intern mentors).
Examples of some good answers to the second question:
I’d like to improve code velocity on larger projects. I haven’t taken enough time to write out a plan and get feedback so that I can build as quickly and confidently on larger projects compared to smaller ones.
Or:
I have a hard time knowing when to rewrite vs refactor vs add to the mess. Sometimes the right thing to do is patch the old code, sometimes the big rewrite is worth it. I find it harder to justify the time for the larger refactors, so end up somewhat frustratedly working with the existing architecture.
Or:
Outside of planning and communicating — another big opportunity for me to grow here is to invest more time in doing external research on how companies manage projects or deploy infrastructure — I think that there’s a lot to learn from others on these fronts.
Peer Reviews
I use the term ‘peer’ loosely here. We basically use one form for all feedback from any other team member, so we may collect reviews not only from other engineers, but also from people you are mentoring or people in other functions outside of engineering that you collaborate with.
Some key questions when considering how you want to use peer feedback are whether or not you want to show it directly to people and whether or not you want to show attribution of the feedback.
We choose not to show attribution of specific feedback to reviewees, because we think some feedback people only feel comfortable sharing when there is no attribution, and often, this is some of the most important feedback for reviewees to see.
Although we do not show attribution of feedback to reviewees, we do show attribution of feedback to the managers compiling reviews. This seems like a middle ground that leads to the most feedback being shared and provides the most information to managers who might want to dig deeper on specific issues with authors of some feedback.
Peer reviews consist of the following questions:
When was this person at their best this quarter? What are some shining moments as a product/software engineer? As a teammate? Give concrete examples.
What are some ways this person could improve as a product/software engineer? As a teammate? Again, give concrete examples.
NB: software engineers are not only responsible for shipping code, but also for helping build a great engineering organization, and we explicitly ask everyone to consider this when writing reviews.
Before we send out the peer review forms, we also ask each person this question:
Are there any areas of responsibility outside the scope of day-to-day engineering (eg, on-call, code review, CI, site reliability, security, recruiting, etc) that you are shepherding and want feedback on?
Then, before you write a peer review for a teammate, you lookup in a directory whether there’s anything else they are responsible for that you should give feedback on.
Examples of good peer feedback look like:
I appreciated Rob’s commitment to refactoring the phone call code. It has been a notoriously thorny and difficult feature with a lot of agent pain attached, and he pushed for setting aside time to clean it up when nobody else was pushing for this as a priority.
Or:
As the primary iOS developer, it might be good to think about roping some more people into iOS work. Rob is still a knowledge silo for big parts of the iOS app, which means that more of the feature and bug work on iOS falls on him.
#protip when sourcing specific examples for peer reviews you are writing, it can be helpful to mine data exhaust from collaboration tools to jog your memory. Places to consider include:
- Github Pull Requests
- Code Reviews
- RFCs
- Engineering Blog Posts
- Feature Release Emails
- Post Mortems
- Eng Retro Notes
- KanBan Boards (we use Airtable)
- Slack History
Manager Review / Compilation
Here is the part where I ultimately spend most of my time, and where I think our specific process for reviews adds a lot of leverage.
When compiling formal reviews for each report, I use the following template:
2017-H2 Review
NAME,
I’ll start with some of the feedback from the team.
Praise
GROUPED_QUOTES
Ideas for Improvement
GROUPED_QUOTES
Looking through the feedback from the team and your self review, I’ll offer some commentary.
COMMENTARY_ON_KEY_THEMES_AND_STRATEGIES_FOR_FUTURE_GROWTH
- Kortina
Review Summary
_Meets Some Meets Most Meets Exceeds Greatly Exceeds Redefines_ Grant: __ Shares (standard vesting schedule)
Comp Increase: $_ / yr_
The goal of this template is to focus my time on where I can specifically be the most valuable to the person being reviewed, which is to help them synthesize the feedback, understand from the team and company perspective how they have been performing, and prioritize the most important opportunities for personal growth.
When writing someone’s review, I first paste this template into a new Google Doc, and then at the very top, I paste in all of the praise and critical feedback from peers, as well as all of the self review, from their respective Google Forms summary spreadsheets.
Grouping and Summarizing Direct Quotes from Peers
The first key leverage point is to directly pull quotes from peers and summarize them thematically. This looks like the following:
You’re willing to take on important projects that need love / have historically been neglected:
I appreciated Rob’s commitment to refactoring the phone call code. It has been a notoriously thorny and difficult feature with a lot of agent pain attached, and he pushed for setting aside time to clean it up when nobody else was pushing for this as a priority.
Rob is willing to take on and execute on impactful projects like phone calls, request entries, checklists
#protip formatting is important here, to distinguish quotes from peers from your commentary as a manager.
I try to scrub / cleanup some of the stylistic peculiarities that might unnecessarily reveal the author, but also will include specific details that may in some cases reveal some information about the author, eg, “When Rob and I worked on project X, ….” narrows the scope of potential authors. But, given that people choose their reviewers, there is some amount of pseudo anonymity anyway, and I strive to be judicious about which quotes of this kind I include. Often, there are concrete examples important for the reviewee to hear, where any attempt at transcribing / anonymizing would not dramatically change the amount of information revealed, and I typically find including the details worth the trade.
Commentary on Key Themes and Strategies for Future Growth
After compiling all of the Praise and Ideas for Improvement from peers, I have a thorough understanding of what the team thinks. I then walk through these along with the self review, and address key points, explaining whether or not my opinion matches the team’s or the reviewee’s on a specific issue, and then offer some suggestions for improving on that point in the future.
This might look something like:
I don’t think you need to be responsible for fixing every iOS bug, but given that historically you have been the point person for iOS, I don’t think anyone else feels empowered to update the process here. At the very least, I’d setup a better / more transparent system for tracking iOS bugs and time to resolution, but even better, float the idea by a few others on the team of having them help out with fixing the iOS bugs and doing some of the cards.
After offering this detailed play by play of the peer and self reviews, I add some higher level thoughts of my own about how each person can grow or take on more responsibility.
For example:
Second, a place you could start taking on more responsibility / ownership is getting more involved in and vocal about staffing infrastructure projects. There has been some concern from the team that we are spending too much time on dev tooling projects (and some concern from others that we are not investing enough in dev tooling or fixes to key systems that would enable everyone to move faster). From my perspective, it feels like we have had a nice mix of work in flight, but in many ways I don’t feel as close to the technical needs as you are, so it would be great to have another judicious opinion from you about when we are spending too much or too little time on infra work.
Review Summary and Compensation
Finally, I’ll fill in the review summary.
We use the following rating scale:
- Meets Some: Serious gap between performance and expectations. Almost certainly entails a performance improvement plan.
- Meets Most Not performing to level of expectations. Problematic and requires concrete improvement.
- Meets: Great work. We have high expectations so this is a solid rating.
- Exceeds: Great work that exceeds all expectations, with respect to things like depth or breadth or sheer volume of contribution.
- Greatly Exceeds: Exceeds all expectations, to a surprising extent, eg, has accomplished a shocking amount of work relative to the rest of the team given their level.
- Redefines: Performed industry changing work: for a senior engineer, this might be pushing an open source project that Facebook ditches React for.
It’s important to note that the rating is based on expectations for the individual, so it’s a moving target, harder to get higher scores the better you are.
In addition to the rating, once per year we do comp adjustments. (Sidebar: it’s really liberating for both reports and managers to do comp adjustments only once per year, rather than constantly diving into comp negotiations ad hoc. It also results, I believe, in more fair treatment across employees, rather than simply benefiting the more vocal, as you can imagine might happen otherwise).
There are 2 components to comp adjustments, equity and base cash compensation increases.
We do equity ‘refreshers’ each cycle, granting more equity to employees each year they work at the company. This equity is subject to our standard vesting schedule, and the way we roughly think about it is “were we to hire this person today, what would their initial offer package include as an equity grant?” The other thing we consider when sizing equity grants is the amount of progress we have made as a company, the goals we have hit, and the questions we have answered about operations or product market fit. Many other startups might only do equity grants as part of offer packages, and then offer more equity only once the vesting for the initial grant completes (if at all). We think, however, that committing to regular annual equity refreshers results in more fair compensation for all employees in the long run.
While the ratings are based on expectations for the individual given past performance and their individual level of expectations, compensation is more grounded in how an individual contributes value to the team and company goals relative to the rest of the team.
There are two key principles governing our basic philosophy around compensation. (1) Since the team comes to work everyday ultimately determines the success of the company, they should be well compensated and dealt in to the financial upside of the success of the company. (2) If everyone were to see everyone else on the team’s comp, everyone should feel good about the fairness of it.
Delivering Reviews
It usually takes me about a day to compile all of the reviews (I can do one in 45 minutes or so), then I meet with everyone in person to discuss them.
I use Fin to schedule 45 minute meetings with each report (spread over 1–2 days).
#protip It’s important to sit side by side with someone in 1:1 meetings between reports and managers. Sitting across a large table can create an adversarial atmosphere.
I ask each person to bring their laptop with them to the review meeting, and I don’t send them the review until they walk in. I imagine myself reading a formal review, seeing things I don’t understand or maybe don’t agree with, and then losing sleep over it until the opportunity to discuss it, so I try to just save everyone some of this stress.
Once someone is in the meeting, I then share the Google Doc with them and tell them, “Take your time reading through. I’ll reread again while you read it, and then we can discuss everything once you are through.”
Then, once they finish reading, I ask, “Is there anything you have questions about? Things that are surprising? Things that resonate?” They talk through any of these questions or concerns, and I offer more context about the feedback and try to help them understand and prioritize what I think is the most important set of takeaways for them to grow and succeed.
Sometimes these meetings can take twenty minutes, and sometimes they can take up to an hour. I find forty-five minutes is usually more than enough time to budget, however.
Final Thoughts
I’m generally very wary of any form of process, as it can easily just add overhead or over optimize focus on metrics to the point of forgetting top level goals.
But process done right can also be a tool that automates repetitive details and liberates you to focus mental energy on things which most require your attention.
Given our current team size and stage of company (and I underscore this premise, because process should always be evaluated and reevaluated given its context), I find our review process consistently helps me learn about the needs of individual team members, extract broader themes and team needs from patterns across reviews, and leaves me really excited about the quality of our team and our potential to do great things going forward.
If you run your review process differently or have any other thoughts or reactions based on this document, I’d love to hear from you. I generally learn a lot from talking shop about eng org stuff like this.
Also, email me if our engineering team sounds like one you’d be interested in joining. We’re hiring.
If you’re interested in working with us, check out Jobs at Fin.
– Kortina
Building Hybrid Intelligence Systems - 2017 Fin Annual Letter // 20 Nov 2017
We started Fin with the premise that mixing human and software intelligence could produce a service better than any pure software ‘assistant’ like Siri or any individual human. (Btw, if you’ve never heard of Fin, it’s a service that provides high quality, on-demand assistance.)
Along the way, we’ve discovered that while hybrid intelligence systems can give you the best of both worlds, they can also give you twice the challenges you might have when dealing strictly with humans or with software alone.
We have learned a ton in the past year, and wanted to share some of the key lessons that have given us more confidence than ever that in the near future most work will be performed by human + software hybrid systems like this one.
Sections
- Shared memory tools make teams smarter and better than any individual can be alone.
- Checklists help even the best humans get things right.
- Using personal context to do the ‘right’ thing for each customer is table stakes for doing work as high quality as a human assistant would.
- Leverage data to reduce variance in human systems.
- Computers are better at math than humans.
- Humans are the universal API.
- Closing thoughts: hybrid intelligence systems should outperform pure software and isolated individual humans.
1. Shared memory tools make teams smarter and better than any individual can be alone.
We operate 24 x 7 x 365, and there is no guarantee that every request from a particular user (or even each part of a single request) gets routed to the same human operations agent on our team, so we can’t rely on any knowledge being ‘cached’ in a person’s brain.
And, because Fin is totally open ended (customers can ask for anything from “can you send flowers to my mom?” to “can you investigate how much it would cost to buy this racetrack?”), we cannot possibly train everyone on our operations team on every kind of request a customer might send in — we can’t even enumerate all the kinds of things someone might ask.
Consequently, we have invested deeply in tools for sharing knowledge about each customer, about each specific request as it gets handled by many people throughout its lifecycle, and about each kind of request the first time we perform an instance of it (eg, buying flowers).
There is some upfront cost to maintaining this ‘shared memory’ for our operations team, but this year we have started to realize many of the advantages we hoped it would pay off with some scale:
(i) Because there is not a 1:1 mapping between customers and operations agents, your Fin assistant never sleeps, gets sick, or vacations and is available 24 x 7 x 365.
(ii) Likewise, Fin can work on many requests in parallel for you, unlike a single human assistant.
(iii) While an individual human assistant only knows what they know / what they learn, Fin’s shared memory entails that any time one agent on the Fin team learns something new about the world or about a best practice, everyone else on the team instantly ‘learns’ or ‘knows’ the same thing, because the knowledge is encoded in our tools. So, for example, when one agent learns a new phone number for making reservations at a tough to book restaurant, or a more efficient way to book rental cars, or a great venue for a company offsite, or a cheaper place to get a certain product, every other agent and every customer of Fin benefits from this knowledge.
These network effects that result from our shared memory approach make the Fin team collectively more knowledgeable than a single individual member could be on their own.
2. Checklists help even the best humans get things right.
All of the knowledge our operations team indexes about best practices, about customers, their preferences and relationships, and about the world is useless if we cannot find it and apply it at the right time.
Because Fin’s shared memory is constantly changing, we cannot simply train operations agents on everything before they start working. So, we store this information in a wiki-like format with a search index on top of it, where any agent can lookup a document with the best practices for any kind of request or find relevant information about a customer on the fly.
This database and search index are not sufficiently reliable on their own, however, because it is easy for someone to miss a key step in a particular workflow when they only read through a how-to document. Or, even if they had thoroughly learned a workflow at some point, their knowledge may have become stale.
Over the past year, we have migrated much of our process knowledge into checklists, which, as The Checklist Manifestofamously describes, help even the most highly skilled professionals like surgeons and pilots dramatically reduce error rates. Our checklists ensure that operations agents do not miss any key steps in known workflows as they handle requests.
But, while surgeons and pilots know ahead of time a few specific checklists they need to use, we have hundreds of checklists comprised of thousands of steps because of the breadth of work Fin does. This means that finding the right checklist to use (if one exists) is another problem we need to solve.
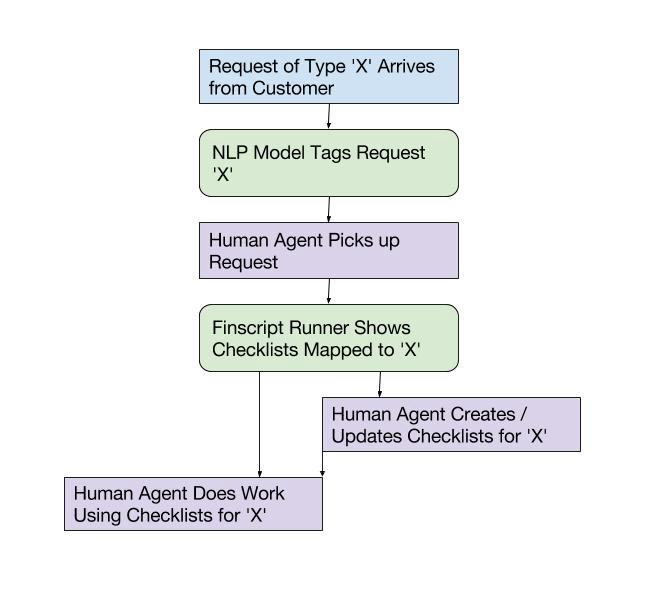
In addition to curating the content of checklists, our operations team is also responsible for managing the rules around what checklists to use when. They author these rules in a variant of javascript we call Finscript.
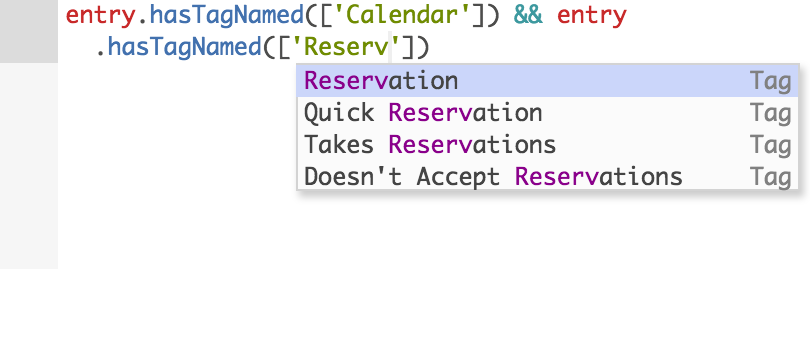
We have some NLP models that tag each request, and because our operations team has mapped each tag to the relevant checklists with Finscript rules, by the time a human agent picks up a request, the relevant checklists are already in front of them, so they don’t have to search for the correct checklist to use (or even be aware that it exists).
3. Using personal context to do the ‘right’ thing for each customer is table stakes for doing work as high quality as a human assistant would.
Probably the most critical type of knowledge stored in Fin’s shared memory is user context.
When you work with a great person for many years, this person gets to know all of your nuanced preferences — your communication style, price sensitivity, prioritization framework, when to take initiative vs. confirm something, the important people and places in your life, etc.
Acquiring this sort of deep knowledge of each customer is table stakes if Fin is going to be as good as (or better than) a human assistant. (As an aside, the atomic treatment of every request without any sort of memory / context is one of the most frustrating things about talking to many pure software voice assistants currently in market — you can’t yet say, “Alexa, can send Rob a link to that bucatini I ordered last week, and get me a few more bags?” Instead, you need to fully specify the parameters of every request each time you interact with Siri or Alexa.)
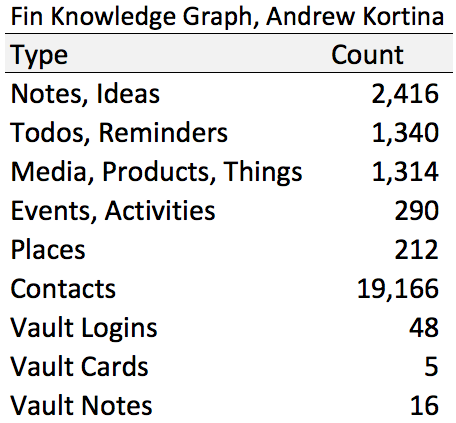
Over the years, Fin has gotten to know many dozens of nuanced preferences about me, like:
- Default duration for work calls: 25 minutes.
- Default spot for morning coffee meetings: Jackson Cafe.
- Do not make reservations at seafood restaurants — Kortina does not eat fish.
- When booking Barry’s Bootcamp, book Treadmill first.
- Use Amex –6000 for all purchases.
- etc, etc, etc…
Likewise, Fin has learned tons of other important context about me that you wouldn’t necessarily call ‘preferences’
It is by storing all of this knowledge in Fin’s shared memory that any agent who picks up a request from me can know that when I say ‘Rob’ I mean ‘Rob Cheung’ or when I say ‘nopa’ I mean the restaurant and not the neighborhood. (Relevant user context and preferences are, btw, surfaced automatically with Finscript in the same way that relevant checklists are, so an agent does not need to know to look for them.)
All of this context is just as critical to Fin doing the right thing when I ask for something as the preferences I explicitly enumerate to Fin as such.
4. Leverage data to reduce variance in human systems.
We have an internal principle: ‘AI’ at Fin means Always Improving. We try to design systems with reinforcing feedback loops that would self improve given no new energy injected from external sources (eg, product development, tools, talent, money).
Adhering to this principle proves difficult given the vast breadth of heterogeneous work we do.
We start to make the problem tractable by measuring absolutely everything that happens in the Fin ecosystem, but even with the many terabytes of data we’ve captured in our Redshift cluster, it has at times been difficult to answer questions like:
- How does our quality of recommendations today compare to 4 weeks ago?
- How does our speed on scheduling requests compare to last week’s?
- Did we spend longer on this request than we should have?
The difficulty in quantifying answers these questions is due to request variance:
- Category of request (eg, research vs. scheduling)
- Complexity of request within the category
- How clearly the request was specified by the customer
- How many round trips the request took to complete
and also due to a vast array of other dimensions and factors like:
- How many new operations agents were onboarded in the past few weeks? What percentage of the entire population did they comprise?
- Was this work performed at the end of someone’s shift or the beginning?
- Was this work performed on a redeye or a daytime shift?
- Was the person performing this work having a bad day?
- Were there any known technical glitches or service latency on a given day?
- Was there some external latency (eg, an outage from an external service provider or long hold times for a new product release or restaurant opening)?
People ask us all the time (i) why we can’t charge a flat rate for requests of a given type or (ii) what the average charge is for a request of a given category.
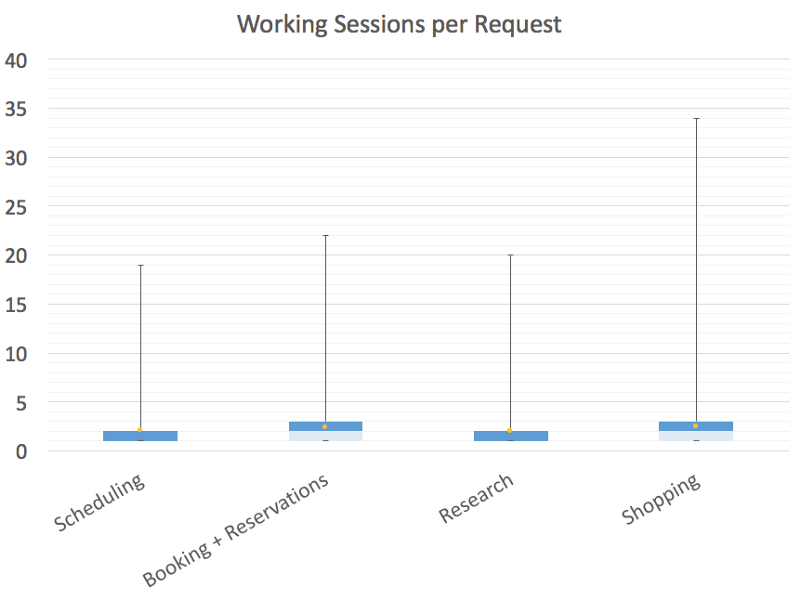
We would love to charge a flat rate per request (and in the past we experimented with charging a flat monthly rate). The problem with this approach is that the high outliers, either in terms of request complexity or heavy usage users, drive up the averages quite high, and the effective rates for the most frequent requests or typical users would be more expensive under a flat rate model.
You can see this by looking at some of the complexity distributions for work we do, both in terms of number of round trips or working sessions to complete a request, or in terms of minutes spent per working session, across a few common categories. In all of these cases, the average falls way above the median.
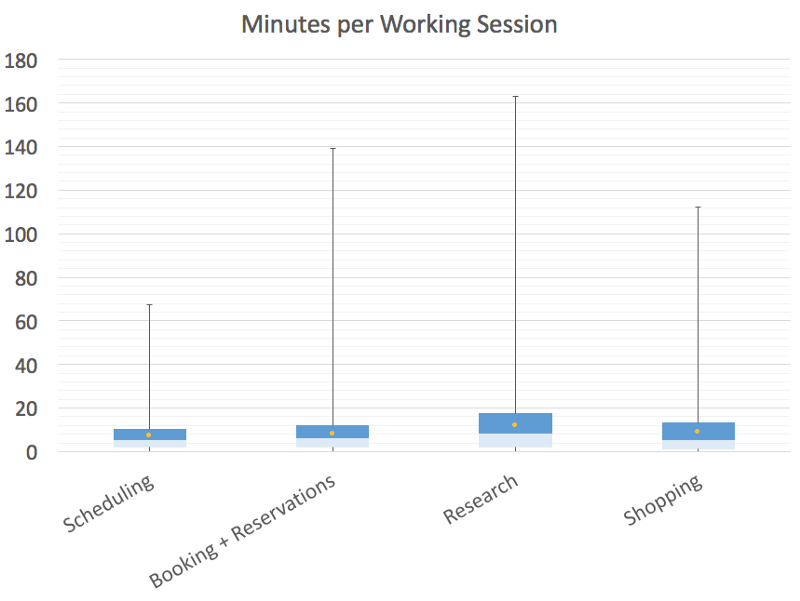
What’s not great about this from a customer perspective is that it makes the price for any given request unpredictable: historically, your price would vary based not only on the complexity of work, but also all of the external and environmental factors I listed above, like who specifically worked on your request and what kind of day they were having.
One of the areas we invested deeply over the past year was making pricing more predictable by smoothing out variance due to all these environmental factors. By studying thousands of requests of different types and complexity, we recently were able to update our pricing to essentially charge for the average time we have observed that a request should take, removing environmental factors like who did it and when.
This has resulted in much smoother, more predictable pricing, which now is mainly a function of the complexity of work requested.
5. Computers are better at math than humans.
This one is a bit tongue in cheek, but worth mentioning since we frequently talk to people outside the company who think that Fin operates entirely on some extremely sophisticated NLP / deep learning / black box software that can perform far more complex tasks than Siri.
In reality, while we have a few language models running that automatically categorize requests and analyze customer sentiment, the models that are the most fundamentally valuable to our business are more numerical.
One example is the model I mentioned in (4), which looks at all the work that happened on a request and determines the complexity in terms of how many minutes the work should have taken to complete. Before we had this model, we had a purely manual quality review process, part of which asked the question, “how long should this request have taken to complete?” Having reviewed hundreds of request transcripts myself, I can personally attest that our model is far more accurate (and far faster) at answering this question than I am.
Another place we lean heavily on software is scheduling. We have one set of models that predicts how much work do we expect customers to demand for each hour of each day of the next 4 weeks. Then, we have another model that takes this as input, along with other parameters describing a pool of operations agents available for work, each with unique constraints and preferences. This second model generates the optimal schedule given all of these inputs, and does a far better job at it than when one of our operations leads tried to do this with an Excel spreadsheet back in the early days.
6. Humans are the universal API.
This one is worth mentioning, because it’s the main reason Fin is able to handle such a wide breadth of tasks.
While we would certainly love to automate things like purchasing things or making restaurant reservations, there are no programmatic APIs that we could use to do most of the work that our customers ask for. Not even all of the restaurants we book are on OpenTable.
One of the things that makes Fin as capable as a human assistant is that we can use the public internet, we can email or text anyone, or we can pickup the phone and call people to get things done for you.
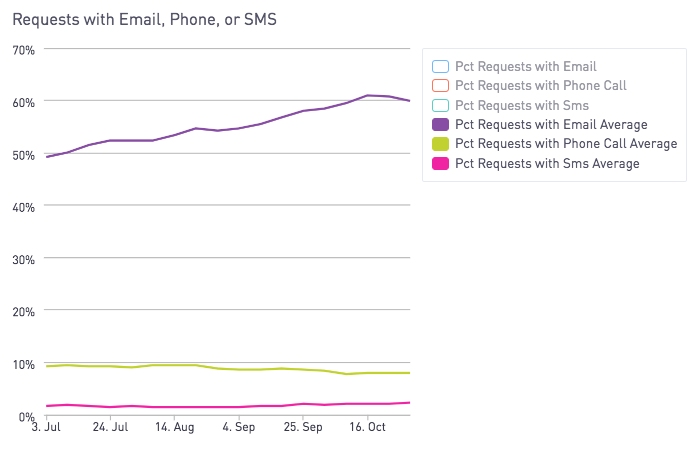
About 60% of requests involve emailing someone, 10% involve a phone call, 2% involve sending an SMS, and nearly every request involves using some internet service outside Fin.
This fact alone entails that there are a huge number of things Fin can do that a pure software assistant won’t be able to do for a very long time, if ever.
7. Closing thoughts: hybrid intelligence systems should outperform pure software and isolated individual humans.
We believe that hybrid systems that leverage great software and a network of humans with shared memory are the future of work. These hybrid systems should outperform what either pure software or isolated individual humans are capable of, on a number of vectors, like cost, efficiency, speed, availability, etc. Just as much computation has moved from self-managed hardware to networked clouds, we believe many other types of work today performed by individuals will migrate to hybrid systems like Fin in the coming years.
Looking back over the past year has been a fun exercise for us, and hopefully gives you a bit more of an understanding of what you can expect from Fin if you’re already a customer (or inspires you to give it a shot if you have not already).
If you’re interested in trying out Fin as a customer, signup here.
If you’re interested in joining our amazing operations team, apply here.
If you’re interested in joining our engineering team, apply here.
If you’d like to come meet our team and talk about hybrid intelligence systems at our holiday party, rsvp here.
– Kortina
Intelligent Work Routing, Dedicated Account Managers, and New Feedback Channels // 13 Feb 2018
Today, we are excited to announce a number of updates designed to level up the overall quality of your Fin experience.
Boosting Speed and Quality with Intelligent Work Routing
To ensure that every Fin request is completed on time, our systems must (i) predict customer demand for any given hour of the day and day of the week, (ii) ensure we have enough people staffed to meet demand at any given time, and (iii) rank which request should be picked up next relative to other requests of varying priority. Historically, by far the most important factor in deciding which piece of work gets done next is the urgency of a request — calling a restaurant to make a dinner reservation for tonight must be done before booking a flight that’s six months out, for example.
Now, however, we have enough volume coming through our systems that whenever someone on our team becomes available to work on something new, there are a number of requests of equal priority ready to be picked up. This gives us the opportunity to start doing cool things to match each piece of work with the best person to handle it. We can match a person with work based on their skills or their familiarity with a certain domain or location or customer. We’ve seen up to 10–20% improvements in the speed and quality of work done based on this intelligent routing, which translates into better service for customers.
Dedicated Account Managers for Every User
One of the benefits of using Fin vs hiring a single human assistant is leveraging the benefits of our entire operations team — they are available to help you 24 x 7 x 365, work on many requests in parallel, and learn new skills and things about the world faster than any one person can.
Starting today, we are also giving each Fin user access to a dedicated Account Manager. You can go to them for help and support, questions, or feedback on any request that you weren’t 100% satisfied with.
Expect an email introduction from your Account Manager today.
New Feedback Channels
For quite some time, you have been able to submit feedback at a per request level through our iOS app, but there has not been a great way to give feedback on email requests (which comprise a large percentage of our work).
Starting this week, each time we complete a request, we’ll email you a link to a feedback form you can use to rate the work done with 1–5 stars. We’ll be turning this feature on gradually for groups of users over the next few weeks.
We anticipate all of these updates will lead to an overall higher quality service for every customer. If you have any feedback on these updates or anything else, let us know! (And if these sound like interesting problems to work on, we’re hiring).
– Kortina
Improving Operations Quality through Measurement and Performance Management // 15 Apr 2018
Earlier this year, I wrote about some changes we were making at Fin to level up the quality of our service. This included providing a Dedicated Account Manager for every customer, as a well as a bunch of updates to our internal metrics and processes. In this post, I want to talk a bit more about improvements to service quality that resulted from two of these changes: (i) more comprehensive and accurate measurement of quality signals and (ii) better ‘windowing’ of metrics to accelerate performance management.
How do you accurately measure service quality?
A few common methods for measuring quality of service for a team include CSAT and NPS. CSAT can be useful for gauging relative quality (either comparing the average performance of different individuals on a team, or comparing your company to another in a similar category). NPS is commonly used to predict customer loyalty and historical trends in the quality of a service or product over time.
Because both of these methods rely on customer surveys and provide only a sampling of customer sentiment and feedback, neither has 100% coverage that alerts you of all poor customer interactions. You must assume that many customers who had a poor experience will not take the time to provide you feedback. Furthermore, sometimes a customer may subjectively label an interaction poor when it’s objectively not a failure. (NB: This may be the result of mismatched expectations, which is arguably itself a kind of failure if you subscribe to ‘customer is always right’ doctrine, but that is outside the scope of this post.)
Completely automated systems (like a sentiment analyzer, eg) may give you broader coverage than user submitted surveys, but also may not be 100% accurate.
Peer review can potentially provide broader sampling than customer surveys, and it may have a more stringent definition of failure that catches some problems that users would miss. But when peers doing the review have team goals that conflict with providing negative feedback to their teammates, you may run into challenges with incentives.
Given that each of these systems for collecting quality signal is imperfect in some way, we have found the best way for scoring quality is to combine and audit all the signals. Here is an overview of how our current quality scoring works:
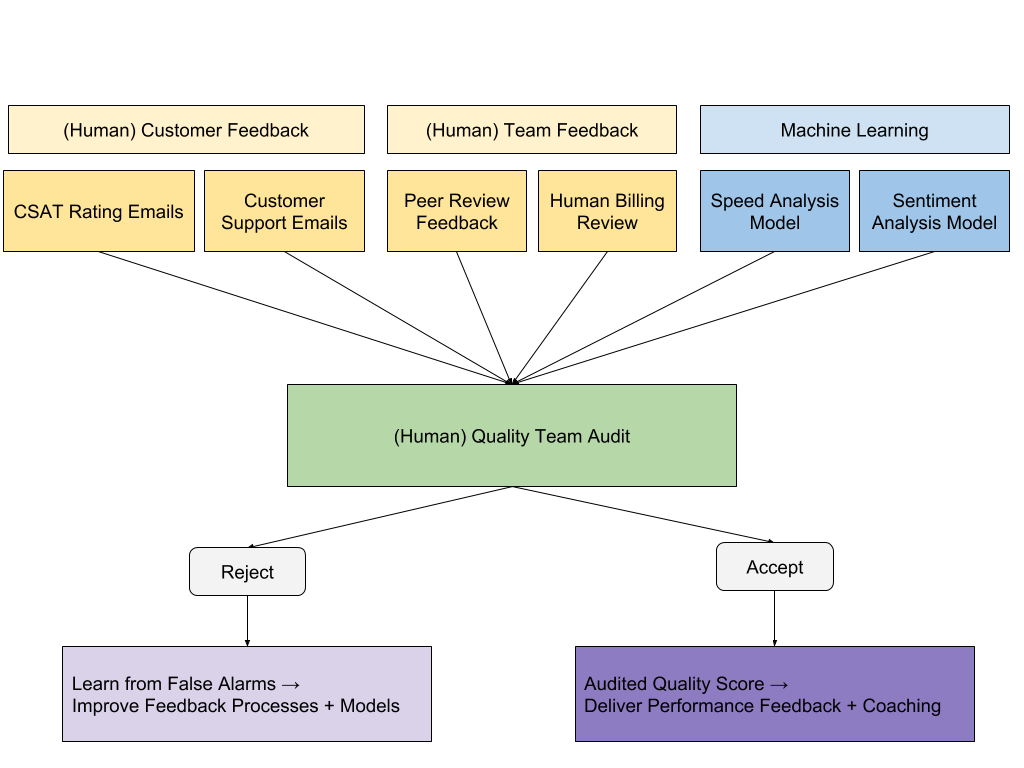
We want to cast as wide a net as we can and so that we limit our chances of any sort of quality issue escaping opportunities (1) for correction before it negatively impacts a customer and (2) for delivering feedback to the person(s) responsible.
At the same time, since we are managing to quality metrics, we don’t want to penalize anyone by decrementing their stats because of a subjective customer response or false alarm of an automated system like our sentiment analysis model. So, we feed all the various quality signals we collect into a (human) audit process to sift the real issues from the false alarms. To mitigate challenges of peer review that I mentioned above, we have created a new dedicated Quality Team that works with Account Managers to perform this audit.
Improving Performance Management by Tightening Metric Windows
Once we were confident we were identifying as many quality issues as possible with our new metrics system, we set aggressive goals for our operations team to drive these down to an acceptable rate.
The most impactful change we made to help the team move towards their goals was tightening time windows for key metrics.
As most startups are probably familiar with, it’s critical to choose the right time window for each metric: you basically want the smallest time window possible which allows for high enough sample sizes that your metric is relatively stable and free of noise and variance. A tighter time window means you can run experiments to get significant results and feedback faster (and ultimately learn and improve faster). So, daily user counts are better than weekly active counts which are better than monthly active counts, provided your per user activity frequency and total number of active users support the tighter windows.
The same holds for performance metrics for individuals – tighter windows allow for faster feedback and improvement.
An opportunity we identified early in the quarter was that almost all of our agent performance metrics were pegged to 4 weeks, which meant 4 weeks to identify when someone needs a performance improvement plan, and then 4 weeks to determine the outcome of that plan.
When midway through the quarter we talked about driving results by the end of the quarter, it became clear this feedback cycle was way too long. So for each of our key performance metrics, we asked ‘how tight can we make the window for this metric to collect enough data to accurately measure it?’ For many important quality metrics, that window was now 2 weeks. That meant for a set of metrics, we could identify the need for a PIP based on only 2 weeks of data, and someone could successfully pass within 2 more weeks. This doubled the speed of our performance feedback loop, from 8 weeks to 4 weeks.
It had the additional benefit of empowering each individual on the team to more quickly understand how changes in their workflow, incorporation of coaching, and attention to detail translated into better results, because it is far easier to move a 14 day average metric with a single day of hard work than to move a 28 day average. Seeing the results of their efforts reflected in key metrics more quickly was a big psychological boost to the team.
Takeaways
This chart visualizes these effects over the quarter. You can see our Quality Issue Rate spike up early in the quarter, when we launched more comprehensive peer review systems and CSAT email surveys, capturing signal that previously went unmeasured. Then, the Issue Rate steadily marched down as we made improvements to our performance management process:
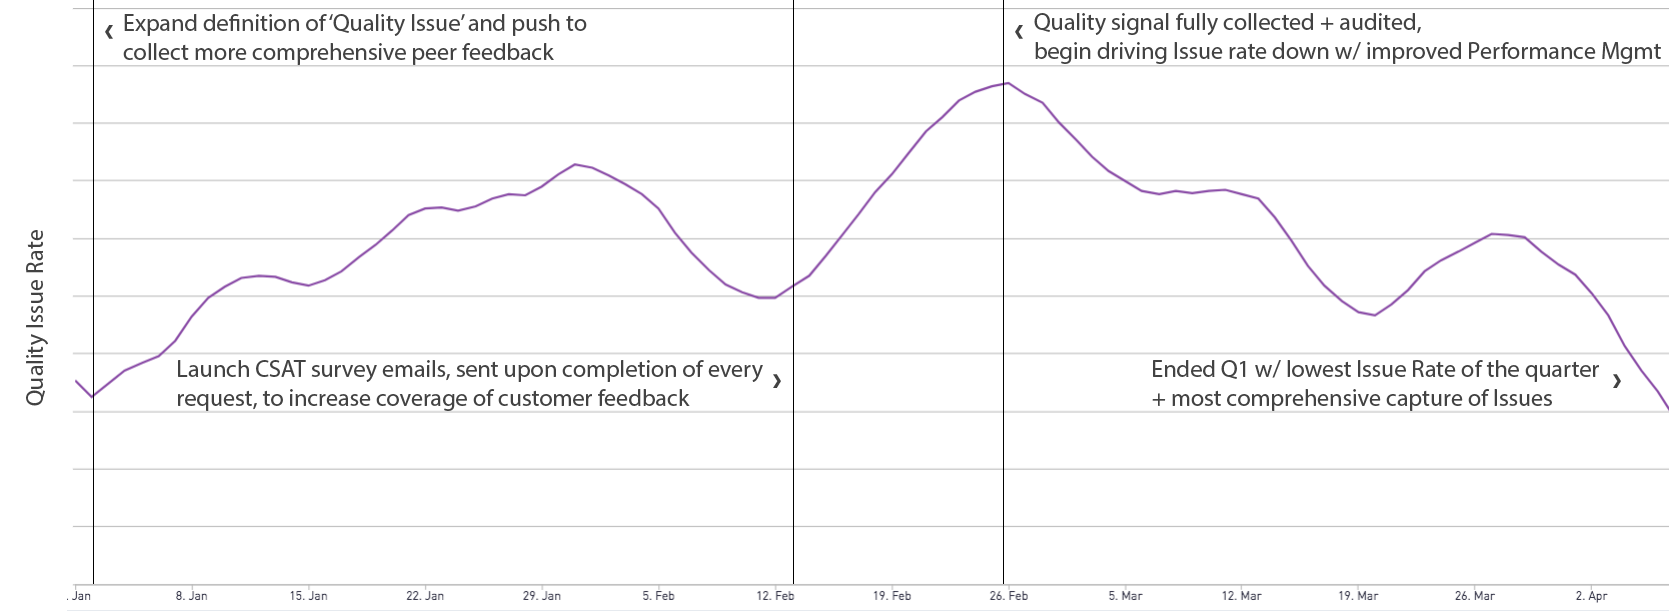
Given the breadth and complexity of the work Fin does, we’ve found very few one size fits all answers. This holds both for various methods of measuring quality, as well as for time windows for different key metrics. Ultimately, ensuring the success of our customers hinges upon our ability to measure and drive the quality and efficiency of operations, so we are constantly on the lookout for new, more accurate, and more comprehensive opportunities for measurement.
ps. If you work in operations or retail and are interested in performance management at scale, we’d love to hear how you think about these challenges.
– Kortina
Finding the Right Person for the Job: Matching Requests of Different Types to Workers with Different Skills // 12 Jun 2018
Here at Fin, as with any large group, our agent team is a heterogeneous mix of people with different types of skills. As we scale our operations team, we want to ensure that incoming requests are always being routed to the agents most capable of completing them quickly and effectively. What follows is a walkthrough of how we capitalize on agents’ differing skill sets to ensure that agents are always working on the types of tasks that they are fastest at.
Routing Work Based on Expected Time-to-Completion
After an agent completes a task, if there is still work sitting in our queue waiting to be picked up (which there inevitably is), then our router has to decide what piece of work to feed that agent next. The router takes into account a number of different variables when making this decision, such as when the request was first made, or if there are any externally-imposed deadlines on the work, e.g. needing to buy a plane ticket before the flight sells out.
All of these other, more pressing considerations being equal, we would then like to preferentially route tasks to agents who we think will be able to complete that work in the shortest amount of time. For each type of task, we have data on how long it took a given agent to complete that type of task in the recent past, and we would like to use this information to determine whether that agent will be significantly faster (or slower) than their peers at completing that type of task in the future. If we can be reasonably confident that an agent will be faster (slower) at completing a certain type of work than their peers, then we should (shouldn’t) route that piece of work to them.
The agent in Figure 1 is significantly faster than the rest of the team at Calendar & Scheduling tasks, but performs at roughly average speed on Booking & Reservation tasks:
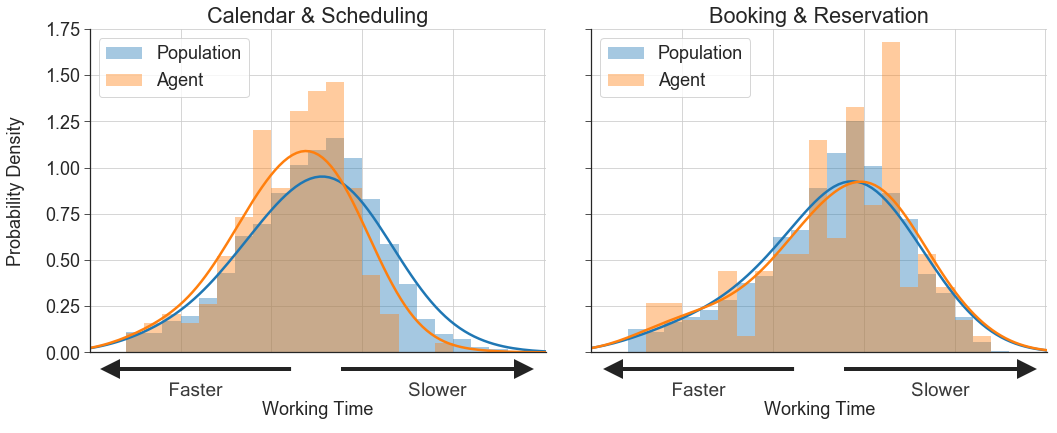
Figure 1. Amount of time it takes a particular agent to complete two different task types compared to the population.
Statistical Hypothesis Testing
Here at Fin, as with any large group, our agent team is a heterogeneous mix of people with different types of skills. As we scale our operations team, we want to ensure that incoming requests are always being routed to the agents most capable of completing them quickly and effectively. What follows is a walkthrough of how we capitalize on agents’ differing skill sets to ensure that agents are always working on the types of tasks that they are fastest at.
Routing Work Based on Expected Time-to-Completion
After an agent completes a task, if there is still work sitting in our queue waiting to be picked up (which there inevitably is), then our router has to decide what piece of work to feed that agent next. The router takes into account a number of different variables when making this decision, such as when the request was first made, or if there are any externally-imposed deadlines on the work, e.g. needing to buy a plane ticket before the flight sells out.
All of these other, more pressing considerations being equal, we would then like to preferentially route tasks to agents who we think will be able to complete that work in the shortest amount of time. For each type of task, we have data on how long it took a given agent to complete that type of task in the recent past, and we would like to use this information to determine whether that agent will be significantly faster (or slower) than their peers at completing that type of task in the future. If we can be reasonably confident that an agent will be faster (slower) at completing a certain type of work than their peers, then we should (shouldn’t) route that piece of work to them.
The agent in Figure 1 is significantly faster than the rest of the team at Calendar & Scheduling tasks, but performs at roughly average speed on Booking & Reservation tasks:
Figure 1. Amount of time it takes a particular agent to complete two different task types compared to the population.
Statistical Hypothesis Testing
The question that we’re asking here, namely, which agents differ significantly from the population in terms of how long it takes them to complete a given task type, is highly amenable to traditional hypothesis testing. The hypotheses that we are trying to decide between are:
- H0: A piece of work from category C completed by agent A is not more likely to be completed faster (or slower) than if that same piece of work were completed by another randomly-selected agent from the population
- H1: A piece of work from category C completed by agent A is more likely to be completed faster (or slower) than if that same piece of work were completed by another randomly-selected agent from the population
For a specific agent A and category of work C, we can answer this question using the Wilcoxon Rank-Sum Test, which can be called in Python using:
from scipy.stats import mannwhitneyu
statistic, pvalue = mannwhitneyu(agent_durations, population_durations, use_continuity=True, alternative='two-sided')
view rawmann_whitney_u_test.py hosted with ❤ by GitHub
Controlling for Multiple Hypotheses
If we simply apply the above test to every agent/category combination, and deem each test significant if its p-value is below the predefined Type 1 error rate cutoff, we will be dramatically inflating our true Type 1 error rate by virtue of having tested hundreds of different hypotheses. The webcomic xkcd illustrates this problem very nicely in the comic below.
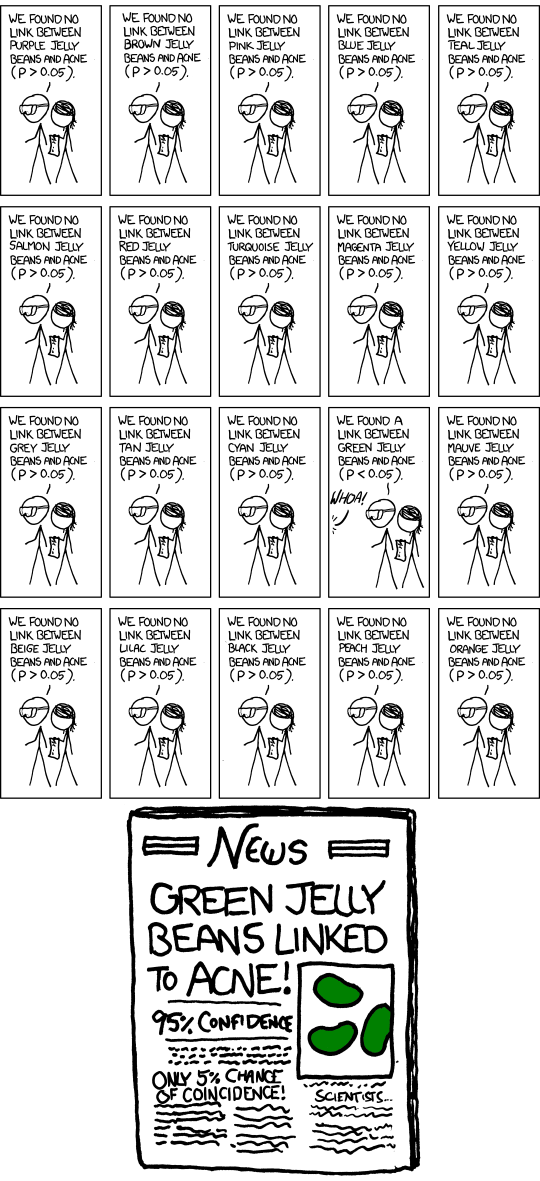
Figure 2. xkcd, warning the public about the dangers of multiple hypothesis testing since 2011
Broadly speaking, there are two approaches to correcting for multiple hypothesis tests:
- Control the Family-wise Error Rate (FWER): Limit the probability that any of our tests conclude that there is a significant difference when none exists
- Control the False Discovery Rate (FDR): Limit the proportion of our tests that conclude that there is a significant difference when none exists
In the above xkcd comic, the scientists should have controlled the FWER, as the cost of falsely alarming the public about a nonexistent health hazard is very high. However, in our case, the cost of a false positive is much lower; it just results in us routing work suboptimally.
For our purposes it is sufficient to control the FDR such that at most 20% of the null hypotheses we reject are false positives. This can be accomplished by using the Benjamini-Hochberg (BH) procedure, which works as follows:
- For each of the m many hypothesis tests performed, order the resulting p-values from least to greatest as
p1,p2,...,pm - For a given false-positive cutoff α (= 0.20 in our case), and a given ordered p-value index i, check whether pi
< α \* i / m - Find the largest i such that this inequality holds, and reject all null hypotheses corresponding to the p-values with indices up to and including i
This test also has a very nice geometric interpretation: Plot each of the p-values as a point with coordinates (i, pi), and plot the cutoff as a line through the origin with slope α / m. Then reject all hypotheses with p-values to the left of the rightmost position where the points cross above the line.
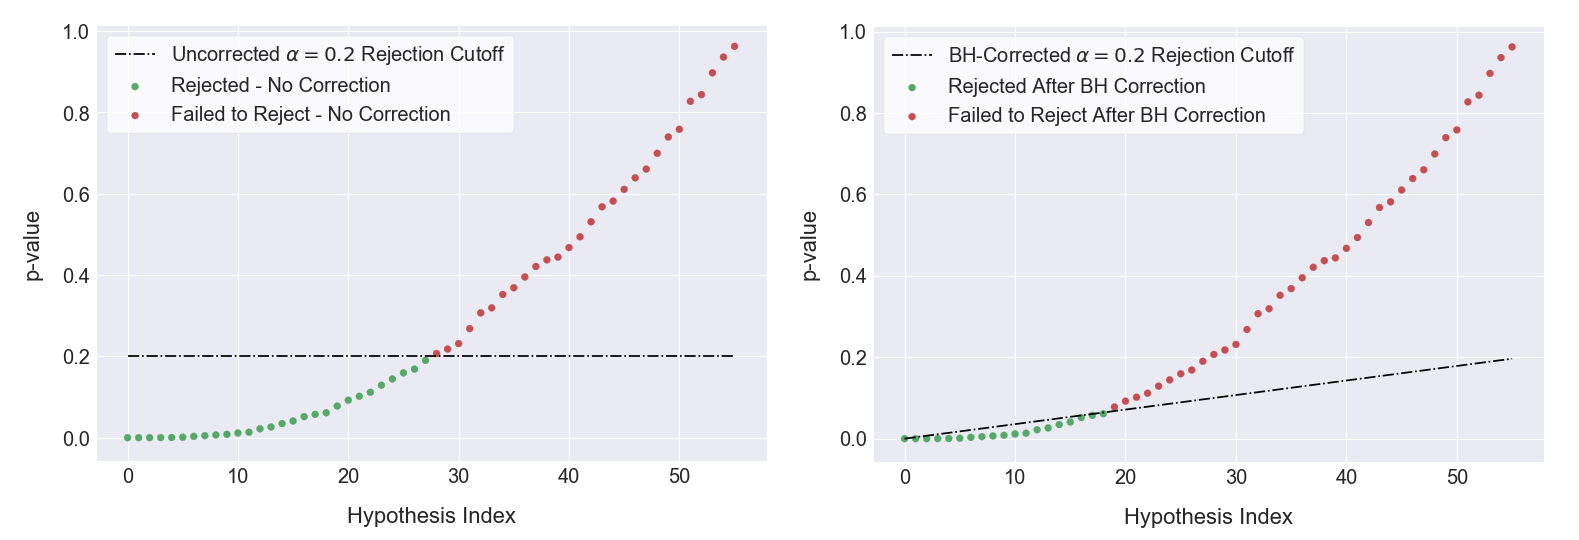
Figure 3. (left) Rejected 50% of Null Hypotheses without performing multiple test correction, (right) Rejected 34% of Null Hypotheses after performing the Benjamini-Hochberg procedure
This test can be called in Python using:
from statsmodels.sandbox.stats.multicomp import multipletests
reject, pvals_corrected, alphacSidak, alphacBonf = multipletests(p_values, alpha=0.2, method='fdr_bh')
view rawbenjamini_hochberg_procedure.py hosted with ❤ by GitHub
Large Effect Size Requirement
One problem with focusing only on p-values is that in practice if your data set is large enough, it is possible to reject any null hypothesis, no matter how minute the difference is between the distributions under consideration. One way to guard against this problem is to impose a further requirement that the effect size, i.e. the magnitude of the difference between the two distributions, be sufficiently large. There are many different ways to quantify effect size, but one simple and easily-interpretable option is to measure the difference between the medians of the two distributions. Specifically, we require that the agent’s median working time and the population-wide median working time must differ by at least 20% for us to care about it. This joint p-value + effect size requirement can be visualized using a so-called “volcano plot”.
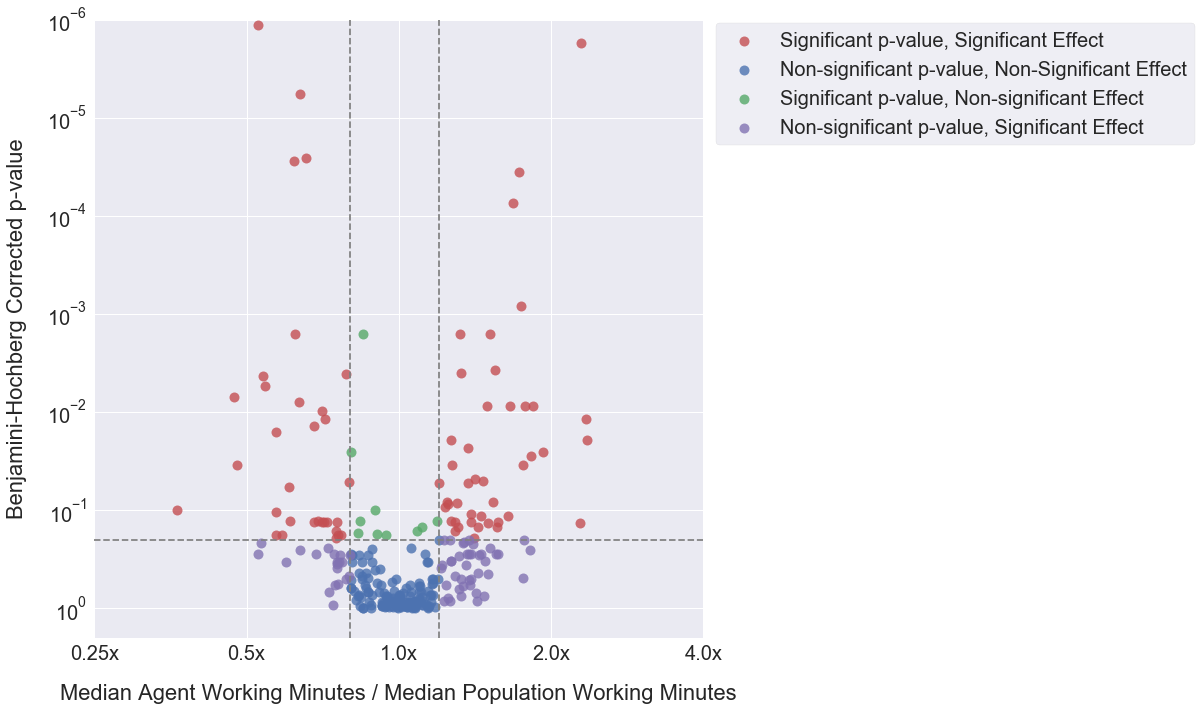
Figure 4. Volcano plot; each point is a single agent/category combination, with red points indicating agents whose working speed on a given category of work differs significantly from the rest of the agent population
Routing Results
Simulating the behavior of this new speed-based router across all work received, we find that preferentially routing work to the agents who complete it most quickly (and away from agents who complete it most slowly) decreases the population-wide median task completion time by 10%. Much of these gains occur in the left shoulder of the distribution, reflecting the fact that more tasks are now being completed “abnormally” quickly.
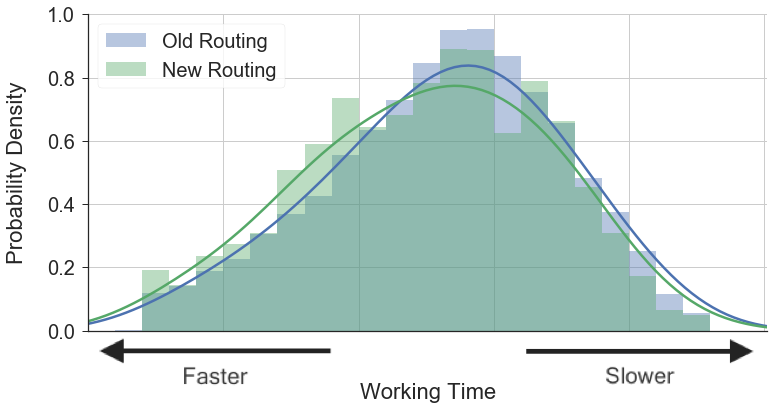
Figure 5. Population-wide per-task working time before and after implementing preferential routing
If you thought this analysis was cool, and are excited about digging into our operational data yourself, apply to be a data scientist at Fin! We’re hiring!
– Jon Simon
Fin has gotten dramatically higher quality and lower cost over the past few months // 18 Jun 2018
Over the past few months, we have made a number of big improvements to the service that I wanted to share with you. In addition to launching a host of new features (which I outline below), we have also made Fin both much higher quality and much lower cost.
50% Improvement in Quality Score
The killer feature of Fin is the confidence you can trust we’ll handle even the most critical tasks–the ones that you wouldn’t ask of a pure software assistant or VA outsourcing service because the cost of error is too high–at the high quality level you could historically only get by hiring a full time EA.
Because customers trust us with critical tasks like booking flights and scheduling important meetings, we track and review every potential quality issue and are obsessed with driving constant improvement through metrics and performance management. The result has been an over 50% improvement in our internal quality score over the past few months.
25% to 40% Price Reduction
In addition to driving much higher quality, we’ve also dramatically improved efficiency with better tools and workflows, resulting in a 25% to 40% price decrease in requests across all major categories in May 2018 vs Jan 2018.
In short, we are delivering higher quality work at lower cost.
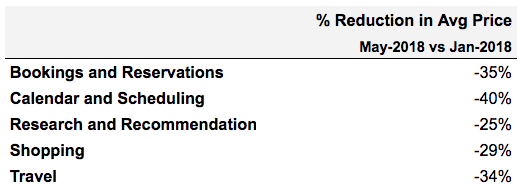
In addition, we’ve also released a bunch of new features.
Recurring Requests Dashboard
You can set routine chores like booking haircuts and doctor appointments or paying bills on autopilot with our new Recurring Requests Dashboard.
Daily Executive Summary
We now send a consolidated summary of all work completed, requests in progress, and important meetings for the day. It’s the one, must read email to help you get started each day.
Phone Answering
Fin can now answer inbound calls for you, and we’ve heard tons of great feedback from customers forwarding their work number to have us pick up (instead of voicemail) or using this as a reception desk for their businesses.
Weekly Phone Syncs
We’ve begun offering a weekly live phone call with Fin to let you braindump and delegate everything you need help with for the week. We’ll also proactively look at your calendar and suggest things we can take off your plate.
Meeting Confirmations
We’ll send an email confirmation a few hours before each meeting on your calendar to ensure all attendees have the key details and make any last minute changes you may need.
Slack Integration
Now you can send requests to Fin via Slack, if that’s where you spend most of your day.
Bulk Discounts
We’re now offering higher tier subscriptions which give you discounted rates if you know you need a significant amount of assistance each month.
Fin for Teams
Consolidated billing and reporting for your entire team.
I’m really excited about all the improvements we have been making over the past few months and hope you enjoy them. As always, let us know if you have any feedback!
– Kortina
Identifying Feature Launch Dates Using Gini Impurity // 07 Jul 2018
In theory a feature update is a very black-and-white event: before the update all requests use the old version of the feature, and after the update all requests use the new version of the feature. Unfortunately the real world is not so tidy, and in our data we often observe requests which utilize a new feature prior to its official release (e.g. when the feature was undergoing pre-launch testing) as well as requests which fail to utilize a new feature even after its official release (e.g. legacy recurring-work tasks).
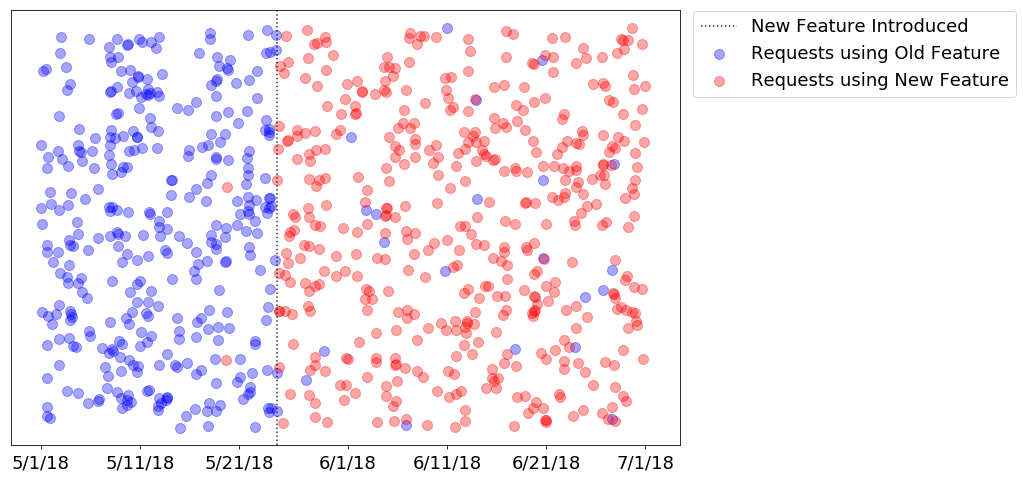
Figure 1. Example of a request feature launch occurring in late May.
From an analytics perspective, this makes it very difficult to analyze the before/after effects of a given feature release, since these edge cases mean that the release boundary is fuzzy, and consequently difficult to programatically identify. Thankfully, there exists a simple mathematical formalism from machine learning which is perfectly suited to pinpointing these fuzzy change-over points: Gini impurity.
Gini impurity is a measure of the homogeneity of a set of labels, and most commonly arises in the context of decision tree learningwhere it’s used to decide whether or not to split on a given dimension.
Formally, for a set of n items having k distinct labels, Gini impurity is computed as:
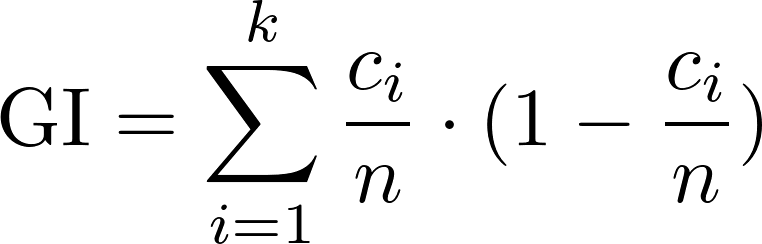
where ci is the number of items having label i
This can be understood as the probability that we misclassify an item in the set, assuming that we randomly assign labels to items according to the set-wide label distribution. The Gini impurity attains a minimum of 0 if all items have the same label, and attains a maximum of 1‑1/k if all k labels occur in equal numbers. A plot of this function when k=2 is shown below, alongside two other measures of label homogeneity:
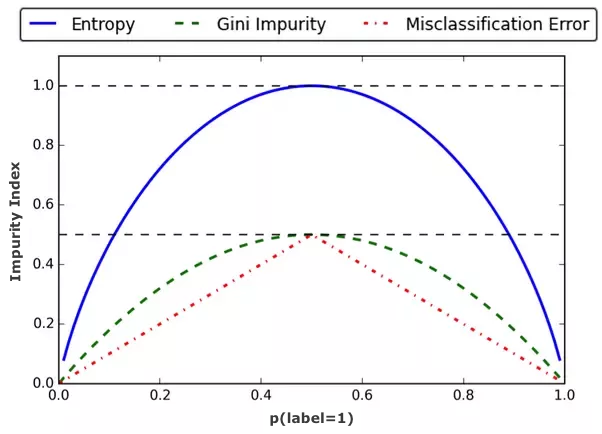
Figure 2. Illustration of how GI, and related measures, change as a function of class label homogeneity
Our problem of identifying when a feature launch occurred is another such two-class situation, where the two label classes are (1) requests which use the old feature version, and (2) requests which use the new feature version. To identify when a feature launch occurred, we look for the timepoint such that GIbefore+GIafteris minimized. For the feature release shown in Figure 1, we can tell from eyeballing the plot that it was launched around May 25th, and superimposing the GI value curve on top of this data, we see that this is precisely where the minimum is attained.
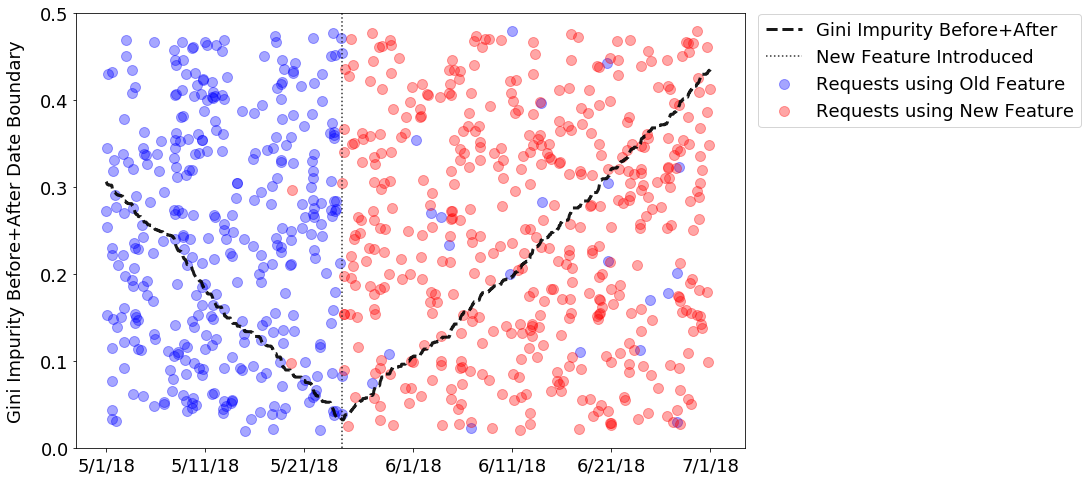
Figure 3. Computing GI as described above for each timepoint, we find that GIbefore+GIafter is minimized precisely when the feature launch occurred.
– Jon Simon
2018 Fin Annual Letter // 31 Oct 2018
There have been some major moves occurring at companies focused on the future of work in the last few months. Robotic Process Automation, a technology that makes it possible to automate repetitive tasks inside businesses, is on fire. UiPath, arguably one of the standard bearers for the RPA industry, just raised a huge round that values it at more than $3 billion after growing from $1 million to $100 million in revenue in less than two years.
Human work aggregators also are doing extremely well. Freelance platform Upwork just had a successful IPO, and TaskUs, a next-generation business process outsourcing firm, just raised $250 million from Blackstone. Many more labor aggregators are benefiting from the new demand of technology companies for content moderation and tagging.
The intellectual narrative also is shifting quickly from discussions of pure-AI futures (which I have always considered fantasy) to practical discussions of a human + machine future. Paul Daugherty, the CTO of Accenture, published a great book called “Human + Machine,” and Kai-Fu Lee’s book on the Chinese viewpoint, “AI Super-Powers,” which is heavily driven by the hybrid-future narrative, is a best seller.
Almost exactly a year ago I wrote a column about the future of work. Specifically, I focused on the role of machine learning and AI in measuring historically unmeasured human knowledge work in a way that could help optimize it.
Building on that theme, over the last year it has become increasingly clear to me that the real way to talk about the future of human knowledge work is as a cloud resource that looks and functions a lot like how Amazon Web Services operates today.
As I see it, today the path forward for knowledge work is using AI and machine learning to effectively build a knowledge-work cloud, with a series of key technical systems that very much resemble what we today use on computing clouds like AWS.
Contextualizing Our Next ‘Industrial’ Revolution
A few centuries ago, new technology like steam power, railroads and pendulum clocks allowed for the Industrial Revolution. These tools enabled people to reorganize how physical work was completed.
Physical production was taken out of distributed, inefficient, and unmeasured piecemeal modules and brought into systems and factories that dramatically increased efficiency, speed and quality. This led to an explosion of prosperity.
The tools alone were just potential. On their own, their impact would have been minimal. It was the tools coupled with the reorganization of human work that led to impact.
In the last few decades, we have unlocked a series of technologies that are every bit as fundamental as those that brought about the Industrial Revolution, and should lead to an explosion of prosperity. Yet human productivity has increased far less than one would expect given the power of our new tools.
The reason that we haven’t yet seen spectacular growth in human knowledge-work productivity is that in order to get the full advantage of our new tools, we need to reorganize the way in which we execute knowledge work. And, thus far, the day-to-day patterns of knowledge work have changed shockingly little.
I believe that we are going to need to build the equivalent of factories for knowledge work if we want to reap the benefits of things like machine learning and AI fully. This is the next great business opportunity that several companies are beginning to recognize and chip away at in various forms.
We aren’t going to see the end of human knowledge work in the foreseeable future. New machines aren’t going to put us out of jobs in the 21st century, just as they didn’t in the successive waves of the industrial revolution a few hundred years ago.
What new technology is doing is allowing us to reorganize how work is done so that human attention can be focused on the most “human” work, and machines can do the most “machine” work.
You can think of this effectively as a modern “Knowledge-Work Cloud” that dramatically increases the speed, efficiency and quality of knowledge work, while providing people with better more flexible jobs focused on completing the most “human” human work.
Our goal at Fin is to build a modern ‘Knowledge-Work Cloud’. Just like cloud-computing platforms, there will likely be a few winners in the space – but not an infinite number. We believe that our engine will dramatically increases the speed, efficiency, and quality of knowledge work while providing people with better more flexible jobs focused on completing the most ‘human’- human work.
Given where we are in the technology cycle, it is pretty clear that the next set of great businesses will be services. They will leverage technology heavily but also have a lot of operational complexity to them. If we get this right we can be the backbone for them the same way AWS has been for a generation of mobile and web companies.
The ‘Knowledge-Work Cloud’ Analogy
In conceptualizing what the future of knowledge work looks like, there are two analogies that are worth exploring. Neither is perfect, but both are highly informative. The first is the evolution of the cloud. The second is the functioning of “the factory.” The cloud analogy expresses something about the benefits of a near-future knowledge-work engine for customers and how they will want to interact with services like these. The “factory” analogy is informative in thinking through how these services should actually function internally as human-computer hybrid clouds.
The Cloud
A generation ago, all businesses owned their own computer hardware. They would buy it from a vendor, wait for it to be delivered and installed, and then spend time and money keeping it running on premises.
The hardware was a capital expense that would depreciate over time. If they bought more hardware than needed, it would sit idle. If they bought too little hardware, they wouldn’t be able to serve their customers or execute the work they needed to do. If new hardware became available, they would have to independently talk to vendors and decide whether the new technology was worth the cost. It was a capital-intense, slow and inefficient process, and many internet companies were killed by errors in forecasting demand in either direction.
Today, of course, almost no one operates their own hardware. Everyone rents infrastructure on demand in the cloud. Per-compute cycle, the cloud can be more expensive than owning your own hardware, but when businesses consider the overall advantages of the cloud, the benefits far outweigh the costs.
The cloud turns fixed cost into variable cost. Dynamic provisioning takes away the challenges of balancing supply and demand for any individual company. No one needs to hire systems administrators or fix hardware that breaks; the computers are maintained by someone else who specializes in maintenance at scale. When new technologies become available, the cloud vendor can figure out how to integrate them to make the cloud more powerful overall, versus each company doing its own analysis and integration work. There even are network effects by allowing servers to be physically near each other. The benefits go on.
The earliest adopters of the cloud were individuals and small businesses for whom the advantages were clear. Large companies took longer than small ones to convert to cloud infrastructure because they had complex requirements, privacy concerns and were already working well enough running their own hardware. But in time, nearly all companies migrated to clouds, because the advantages were clear. Those that didn’t, lost.
Many if not all of these realities for the why and how of the move to the cloud apply to how knowledge work will evolve and how customers will interact with knowledge-work-clouds in the future.We believe that many of these realities apply to how customers will interact with fin in the future.
Hiring, training and managing people is analogous to the challenges of hardware, with similar lead-times, provisioning and maintenance costs. Businesses miss out on opportunities and even fail because they over- or under-provision human attention just as they did hardware.
The cloud solution is synonymous for human knowledge work. We can drive the same benefits for companies doing important work by allowing them on-demand access in a scalable way to a pool of human resources. We as a company can be better at hiring, training and managing people than small companies can. We as a company can do a far better job building in technological efficiencies at scale and managing supply and demand.
It also is likely that we will face the same challenges in adoption that the cloud did. The earliest users will be individuals and small businesses, and large organizations, while intellectually intrigued, are going to take longer to come around. But the opportunity is as massive as cloud computer infrastructure, if not, in fact, bigger.
The Factory
If the cloud analogy tells you something important about why knowledge work is going to move to a cloud model, the factory analogy is informative for thinking about how to build and optimize a modern knowledge-work cloud.
Any well-run factory is a hybrid system of machines and people that is deeply measured and constantly optimized for speed, quality and efficiency.
On the production floor, machines do what machines are best at—moving a production line and executing a certain repeated process over and over. People do what people are best at, making judgment calls and doing detailed work that machines are incapable of doing well and managing quality control. Even the most advanced factories in the world use human attention, intervention and judgment to achieve more efficiency and higher quality than would be possible using machines alone.
The factory itself has several other key functions that keep the overall system as efficient as possible. For a factory to run well, the operators need to balance the supply and demand of work for the factory (too much demand and orders are missed; too little, and the factory runs idle). The operators need to source raw material and talent to operate the factory. The operators need to constantly be measuring and optimizing the production lines. The operators need to do quality control of end products, rework issues and make sure they are hitting customer specifications on time and on budget.
The Cloud Factory for Knowledge Work
It is clear that in 2018 we are still operating in what might be viewed as a pre-industrial age for knowledge work, and just starting to peek into the future. The knowledge tasks completed by office workers all over the world are unmeasured, unoptimized and massively under-leveraged.
It is an enormous missed opportunity that professionals spend upward of half their time on administrative tasks. It is an enormous missed opportunity that people in administrative roles spend upward of half their time on call but idle, waiting for work, without the tools or measurement to optimize their process.
This should and will get fixed, and machine learning and large scale data-structures give us the tools to dramatically empower work. The way we are going to do it is through a cloud knowledge-work engine that can practically deliver the productivity gains from new technologies that we should have unlocked, but aren’t yet seeing.
It is an enormous missed opportunity that professionals spend upward of half their time on administrative tasks. We think we can fix this.
Further, if we are successful at Fin we should unlock all sorts of new small businesses, just as the cloud has. We should make all businesses and professionals far more productive, as the cloud has.
Key Systems: Routing, Workflows and Measurement
If you believe that we will move toward a cloud for knowledge work, one obvious question is what the key subsystems will be of such a system and, specifically, where is there going to be a lot of leverage from machine learning and AI?
Work Routing
The first key component is work routing—moving the right tasks to the right people at any given time. This is very similar to the queuing problem that engineers are familiar with, and which Amazon Web Services provides services for such as with SQS.
The difference is in complexity. Any given knowledge work task might have dozens or hundreds of factors that come into play. How urgent is the work, how long do you expect it to take, who is the best person to do it and when will the person be available? If you give it to someone else, are you trading speed for efficiency or for quality?
Without serious technology, it is hard for people to properly prioritize their own work. It is even harder to take a small team of people and prioritize what each person is doing on properly, and it is basically impossible to properly assign tasks to more than a few dozen people efficiently at scale. Modern technology and machine learning is a huge lever over this problem, and it turns out that assigning the right work to the right people at the right time is a huge lever over productivity overall.
We have seen this first hand at Fin. In the last year we have gotten extremely large and measurable returns from refining how we ‘route’ work to the right different people in different situations. We take into account basic things, like when the task is due and who is free to work on it. We also take into account more sophisticated questions – who as worked on a given task before, who has worked for the user before, which agent available is ‘best’ at the type of work being requested, etc.
Shared Workflows & Context
The second key component where machines can have massive leverage over productivity in a knowledge-work cloud is managing workflows and context. When someone is assigned a knowledge task, the organization overall likely already has some knowledge about how to best complete the task. It doesn’t matter if you are writing a presentation, doing research or booking a flight; there are known best practices and knowledge about how to do the task best.
In our current world, most workflows are transmitted through word of mouth or casual context. Each new employee at a job learns the general shape of the workflows they are responsible for from colleagues over time, and then perhaps tweaks them based on their own beliefs or preferences.
This is no way to run a modern system, and a place that machines can help people be dramatically more efficient and deliver better work. In the modern knowledge-work cloud services, machines will learn the process that people are doing, allow managers to tweak and improve the way they want work done, and then make sure that when work is being done by a person, it is being done with the best practice steps, knowledge and validation.
This is another thing we have made big strides on in the last year with Fin. We evolved from a checklist based system to a flexible workflow building engine that allows us to generate both universal and personalized workflows for different types of tasks. We have built in validations & the ability to make sure that the work done / inputs and outputs at certain steps are logical and properly formatted – and great templating for responses, etc. from the work done.
Measurement
You can’t optimize what you don’t measure, and knowledge work historically has been extremely unmeasured. I extensively talked about measurement in my column a year ago on the future of work, so I won’t revisit it here in detail.
Suffice it to say, however, that the No. 1 thing that is needed in order to drive the future of a knowledge-work cloud is technology that allows us to measure the process and performance of knowledge workers.
There were a lot of key figures that helped push the Industrial Revolution, but Frederick Taylor, who was the one to take time measurement seriously toward the end of optimizing industrial systems, was the most important early pioneer in the knowledge work revolution.
This is the area we have been investing in the longest – and seen the most dramatic returns from. Early on, we figured out that traditional operations metrics weren’t going to cut it for us – we needed very personalized understanding per operations agent on what was working and what wasn’t. Look for some really exciting announcements from us soon on this front.
Creating Better Jobs
People look back on the history of the first Industrial Revolution and fear that new work systems will make human work worse.
The Industrial Revolution, at least in the short term, was obviously not good for workers. Factories took people out of their homes and away from families, with sometimes brutal and unhealthy working conditions.
How do we not repeat these mistakes?
There are undeniable realities that a knowledge-cloud system should remove specialization and specialized knowledge from individual workers. This is a scary prospect in the extreme. In a system like the one we are discussing here, all knowledge becomes collaboratively shared among the team, which means that workers can’t build personal moats based on what they know or have figured out over time.
The sort of system we are discussing here also exposes people in knowledge-work fields to the brunt of globalization. At least in the U.S., this is clearly a challenge going forward for knowledge workers, as it has been over the last century for traditional factory workers. The world might be getting better off on average, but those at the top of the pyramid in the best economies clearly have more to lose than to gain from as producers.
The answer has to be that as we move toward the future of work, we take as much advantage as possible of the very beneficial aspects of the powerful combination of people and machines, while still acknowledging the challenges.
One very positive aspect of this type of system is that most of the drudgery of simple tasks goes away. People generally don’t like doing things that machines can do. It is demeaning to be asked to do tasks a machine can do. If you can automate it and hand it to a machine, in a knowledge cloud factory, you will do precisely that, and that type of work will largely disappear.
Working in a modern knowledge-work cloud factory should help people optimize to only focus on what they are most capable doing. People aren’t evenly good at all things, but most jobs require people to do things they are very good at and like, as well as other things of which they are less capable and enjoy less. The beauty of the future system we are discussing is that it makes it reasonably easy to balance work across many people, and focus people on the types of human work they are in particular best at. This is good for productivity, and generally should be good for individual satisfaction with work.
This model for knowledge work should also provide a massive amount of flexibility for people on how and when they work, as well as how much they want to work. On-demand jobs show what is possible, but the current reality is that knowledge workers are still largely stuck in offices and working standardized weeks to facilitate collaboration and manage the realities of specialized knowledge held by individuals. Knowledge work should be able to move toward the best aspects of on-demand jobs, where far more people can work as much as they want, when they want, and where they want.
Working in a highly measured and optimized system with great feedback also is highly meritocratic. It is easy to identify and cultivate the hardest working and most talented people. This is generally a good thing, in my mind, though I acknowledge that meritocracy stretched to the extreme creates other challenging social pressures (see the movie “Gattaca” for a great discussion of this challenge).
Ultimately, however, the move toward more productive workplaces has to rely on the idea that people become free to work less. This is not a new vision. The idea that ultimately people benefit from being more productive because it means they don’t need to work as much is as old as technology, and has a spotty track record. But I believe the ultimate dream has to be that if you can use a new organization of knowledge work to dramatically boost productivity and drive down idle or unoptimized time for knowledge workers, they should be better off.
2019
There are countless books that have been written about why the Industrial Revolution happened in England when it did, and not earlier or later.
We have had amazing new technologies at our disposal that are the raw ingredients for creating another industrial revolution of knowledge work for quite some time now, but we haven’t yet seen the payoff.
But I think it is going to come very soon now.
2018 has quietly shaped up to be a big year for the move toward the future of knowledge work. And I believe that in 2019, we are going to start seeing the pieces fall into place for the explicit move of knowledge work into the cloud.
The blueprint we are going to be following is exactly the move to the cloud that we just experienced for computer resources, but the practical impact should be much much greater.
Fin’s Approach in 2019
For the last few years we have been building up the Fin ‘Assistant’ service on an end-to-end AAI ‘cloud factory’ model. We chose to target this use case first because it has several properties we think breed good discipline in building towards the future we are discussing - it forces us to deal with broad and ambiguous tasks, and is relatively easy for a broad set of people to take advantage of early / everyone can use assistance.
Coming in to 2019 our assistant service is coming along nicely. We have thousands of personal and professional customers using fin to get more leverage on-demand in their lives with booking, buying, research, etc.
The economics of the business fundamentally work, we are growing, and we have built the core technical and human services we need to deliver on our vertical use-case as well as — we think – point us towards the knowledge-cloud future we are discussing here.
Going into 2019 you can expect a few things from Fin as a company:
- Improving Quality, Speed, and Personalization: This is the whole point and we will never be done. Our ‘cloud factory’ means that we are well set up to continuously improve the quality, speed, and personalization of the assistance service we can offer
- Growth in SMBs and the beginnings of enterprise use:Following much the same pattern as cloud computing has followed over the last decade – we started with individual professionals and small businesses. They are the fastest to adopt new technologies. Today, we have started to service SMBs and teams that understand how much leverage they can open up for their professionals by adding an assistance layer. Look for us to get better and better at servicing SMBs, and from there we will start to engage with larger enterprises. It took AWS years to build the security and compliance functions needed to get enterprises comfortable with their offering – we will get there.
- The beginning of cloud service offerings: Finally, moving into 2019 look for us to start offering explicit services for operations teams looking to modernize and start moving towards this cloud-factory model. We believe in offering our own end-to-end service … we believe we can do assistance better & it is how we have the experience of operating first-hand… but there is no question that there is a lot of impact to be had in the world by providing tools to help the millions of knowledge workers in the world be more efficient and productive.
Here is to the year ahead – thanks for being part of the broader Fin journey, and if you have any questions, of course feel free to reach out!
– Sam
Measuring Work-Mixture Changes using Jensen Shannon Divergence // 04 Nov 2018
Here at Fin, we do so many different kinds of work for users, from scheduling haircuts to researching vacations, that a common question that arises is “Are we doing the same mix of work now as we were doing a few weeks ago?”
While it is obvious when our work mixture changes dramatically, such as occurred in mid-September when we made it much easier for users for sign-up for weekly phone-syncs (light-blue region in Figure 1), most of the time the changes are much subtler.
We can think of our work mixture in any given week as a probability distribution p(x) across all types of requests that we handle. So for example, it might be that 9% of requests are to schedule a meeting, 3% are to book a flight, 5% are to make a restaurant reservation, etc
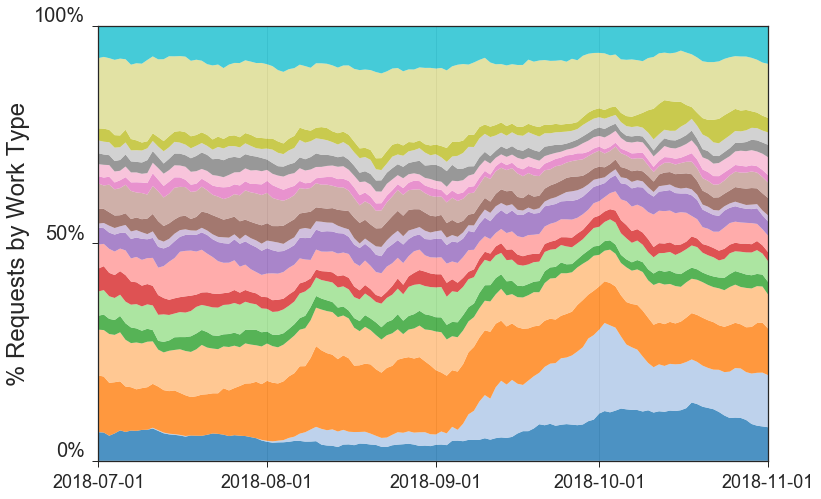
Figure 1. Distribution of user requests by work type.
In this case we can rephrase the question about how much our work mixture is changing over time as “How far away is the current probability distribution from the probability distribution from a few weeks ago?”
As it turns out, there are many ways to measure the distance between two probability distributions, but in cases such as this where work-types may be added or removed*, and where there isn’t a straightforward way to quantify the “closeness” of individual work types**, then the natural distance measure is the Jensen-Shannon (JS) divergence.
Given two probability distributions p(x) and q(x) the JS divergence between the two distributions is defined as
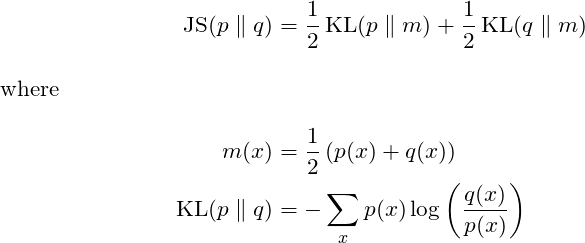
where KL(p || q) is the Kullback–Leibler (KL) divergence, which can be understood as the amount of additional information required to specify observations drawn from the distribution p(x) if we base our coding scheme on the distribution q(x). (For additional intuition about the KL divergence, refer to one of the many, many, manyexplanations available online.)
The JS divergence is a symmetrized version of the KL divergence, where we are attempting to describe both the distribution p(x) and the distribution q(x) using a “blended” distribution m(x).
Representing p(x) and q(x) as arrays, we can compute the JS divergence in Python as:
from scipy.stats import entropy
def jensen_shannon_div(p, q):
  m = (p + q) / 2
  return (entropy(p, m) + entropy(q, m)) / 2.0
view rawjensen_shannon_divergence.py hosted with ❤ by GitHub
Comparing the distribution of work each week to the distribution at the start of July, the surge in phone syncs in mid-September clearly stand out, however we also notice a more subtle shift in mid-August, which corresponds to when we began catering more heavily to business users.
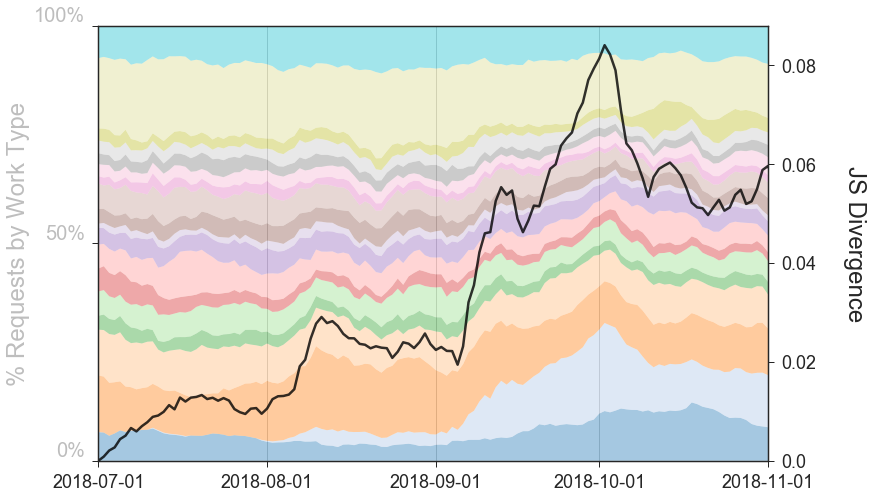
Figure 2: JS divergence of work-mixture compared to July 1st.
If you thought this was cool, and would like a chance to dive into our data yourself, you should apply to be a data scientist at Fin!
Notes
* If work-types were only added, and not removed, we could use the Kullback–Leibler (KL) divergence
** If there existed a natural way of measuring distances between work-types, we could use the Wasserstein metric
– Jon Simon
Fin’s Plan for 2019 // 18 Dec 2018
In the last few weeks we have been spending a lot of time making decisions about our goals for next year.
We are at an interesting juncture as a startup. In Q4 we had our strongest quarter ever in terms of user growth and usage on the Fin Assistant service. We were also able to break-even on the cost of providing service. At the same time, we took our first step commercializing some of the key technology we use behind the scenes to make Fin work, making it available to other operations teams.
Specifically, we released Fin Analytics, which is the tool we developed internally to coach our operations team members and provide rich analytics on operations work, which we believe is a key pillar of the future of work. Dozens of clients have expressed interest in major deployments.
After a lot of deliberation, we have come to the decision to double down on our Fin Analytics product and discontinue the Fin Assistant service in 2019.
As a small startup, it is difficult to do a single thing well and nearly impossible do two things well at the same time, so we have chosen to focus on Fin Analytics in 2019.
Obviously this is a big decision that has implications not only for our team, but also for customers who have been using our Assistant service. So, we wanted to share some context on our thinking and decision and a bit about what next year holds for the company.
Background: Fin Assistant
When we started the Fin Exploration Company a few years ago, our mission was to explore the future of human + machine ‘hybrid’ knowledge work. We were very very skeptical of the pure-AI visions being floated by many at the time, but were extremely bullish on how machine learning could be applied to improve knowledge work.
We asked ourselves: Can we figure out how to practically combine modern technology and human intelligence to make knowledge tasks more efficient and higher quality?
To explore this idea, we chose to build the Fin Assistant service.
We chose this course because we strongly believe that one of the best ways to learn is by “doing.” We particularly liked assistance work (scheduling, booking, buying, research, managing recurring tasks, etc.) as a starting point for a series of reasons, including: (1) it is open-ended, which makes it hard, but, as a result, the lessons are broadly generalizable (2) it requires very high levels of quality and timeliness to be trusted and useful, which matches to most knowledge work broadly (3) it is highly personalized - people want things done different ways, which again forces systems thinking vs. deep optimization, (4) it is a service that we wanted to exist.
A few years later, we are proud of the service and experience we have built. The service breaks even on the basis of the cost of operations work, and thousands of people rely on Fin as an executive and/or personal assistant. Last quarter, in particular, was our highest growth and heaviest usage quarter ever. Our tools have progressed dramatically; our operations team has professionalized and set itself up for scale, and our ability to measure and optimize progress of a black box service for performing arbitrary knowledge work tasks is light-years ahead of where we started.
Background: The Technology & Fin Analytics
In order to deliver the Fin Assistant service, we built (and re-built) a stack of technical systems that users never see, but ultimately make the product possible. The further we drove to develop these systems, the more we became convinced that these systems / systems like them will in fact change how all knowledge work is done on teams and have extremely deep impact on the world.
We iterated through different approaches to things like how to prioritize and route the right work to the right person at the right time.
We iterated through many approaches to managing human work itself: how you encode the steps in process for people, validate answers, customize / branch preferences, manage process updates and set up tasks for machine assistance from historical or customer context on similar tasks.
We iterated through how to manage knowledge about the ‘state’ of tasks and hand off context efficiently between people.
And, we also iterated through measurement and coaching technology to help our human teams improve.
What started as vague ideas or guesses as to what systems we needed and how to build them became pretty concrete systems and answers. In 2019, we plan to open-source a ton of what we have learned across almost all of these domains in a white paper.
But, the biggest insight of the whole technical journey has been about measurement, in particular, how measurement and data can improve feedback and coaching for people doing knowledge work. You can’t improve what you don’t measure, and we believe that we have become experts in a very unique approach to this problem.
As Sam wrote about in his annual letter in October, we have increasingly come to see measurement and coaching as the fundamental cornerstone to unlocking knowledge work for the future, and we are increasingly convinced that this is something we want to share broadly with the world.
After stumbling across this insight, in the last quarter of this year, we re-built our measurement and coaching tools so that other companies that have operations teams could use them to coach agents with more specific feedback and to find the biggest opportunities to optimize process.
Fin Analytics as a tool saves the history of work done by operations teams in screen-recorded video and an action stream of work. It automatically adds context and alerting around the content and allows operations agents to ‘mark up’ the video with questions and for review by managers, as well as issues and bugs for product and engineering teams. It helps teams dramatically improve and personalize coaching, and provides deep insights to teams in how to refine tools and process.
The response has been overwhelmingly positive. There are a huge number of teams, ranging from big traditional support services, to next generation human-in-the-loop technology services that understand and are excited about the impact of the tools we have built.
We are excited to double down on helping operations teams—and potentially millions of knowledge workers—dramatically improve their efficiency and quality with the right tools.
The Decision to Focus Deeply on Fin Analytics in 2019
So, as the year has come to a close, the question is, where should we focus Fin’s attention in 2019? Small startups really can’t manage multiple products at the same time.
Based on the strong initial interest from companies, we decided to focus on our measurement and coaching tool, Fin Analytics, and to discontinue the Fin Assistant service towards the end of January.
We believe that the Fin Analytics product has the ability to be insanely impactful for millions of knowledge workers. We also believe that getting the measurement and analytics platform right will open up the opportunity for us to play a major role in the future of knowledge work and help build the knowledge work cloud we see coming.
We want to be the platform that millions of knowledge workers use for getting the continuous feedback they need to do their jobs better and more efficiently with technology, and we think this is highly achievable.
Some might ask, why not leave the Fin Assistant service running even if you are focused on the Analytics product?
The answer is that we don’t think we can maintain high quality and continue to improve the Assistant service if we want to build out our measurement and coaching service, and it doesn’t make sense to have a product like Fin Assistant in the market unless we can fully dedicate ourselves to optimizing and growing it. Unlike pure software, you can’t simply leave a service like Fin Assistant in steady state, it requires constant investment, an investment we can’t simultaneously make while pursuing Fin Analytics.
This is a difficult call to make. We believe that on-demand assistance for professionals is an important part of the future, and we don’t take ending the service lightly. But as a startup that very much believes in the future of work, we believe that it is the way we can have the biggest impact, and build the most successful company. We will work hard to recommend other services to transition our customers to.
If you run an operations team and are interested in learning more about Fin Analytics, please let us know by emailing founders@finxpc.com.
Next Steps
We recognize that deciding to go all in on Fin Analytics has implications for the customers that have bet on us and been relying on our Fin Assistant service.
We have reached out to our users who know we will be continuing service for a while to help with continuity, and we will also be helping them transition to other on-demand assistant services (or to things like upwork) if they want. If you have an assistant service and you want to make an offer to our user base, please email founders@finxpc.com and let us know. We will list you as a resource for them.
Conclusion
There was a reason we incorporated as the ‘Fin Exploration Company.’ We knew that we were setting out to explore a space that was important, but opaque.
In the coming years we are very convinced that a series of technologies will come together to form a ‘knowledge work cloud,’ which will help people be far more efficient and do higher quality knowledge work across a whole set of industries. We think that this revolution will be every bit as important as the industrial revolution.
Working on the Fin Assistant service has led us to an exciting opportunity to build what we see as a critical part of that stack, and perhaps in time will put us in position to build other parts that we see as critical as well.
To everyone that has supported us getting to this place and making this move, thank you.
– Sam and Kortina
Talking Fin Analytics with Harry Stebbings // 04 Feb 2019
Our co-founder Sam Lessin joined Harry Stebbings on his podcast to discuss a range of topics, including Fin Analytics and the Future of Work. You can listen to the section about what we do at Fin Analytics below or for the full podcast on this, plus investing, crypto, and more, visit The 20 Minute VC
– Sam
AAI 2018 Conference // 05 Feb 2019
In 2018 Fin and Slow Ventures sponsored a conference on ‘artificial artificial intelligence’ – strategies for the future of services that leverage the best of human and machine intelligence to provide superior services in consumer and business use-cases. Posted here is the content from the event.
Anatomy of AAI Introduction from Sam Lessin - a big picture on the future of work, and the evolution of AAI services in the last several years. direct link
All About People All AAI services have people at the core. We will discuss: How to weigh choices between crowdsourcing, vs. contractors, vs. full time hires? Foreign vs. Domestic? Approaches to training, quality management, scheduling, and more. Participants: Chris Calmeyn (Fetcher), Charlie Pinto (Google & Bling), Scott Raymond (ex-Airbnb) direct link
The Leverage of Technology & Automation AAI systems get leverage from technology and automation. Companies take different approaches to how they choose to automate fully, vs. semi-automate, vs. leave manual processes. How do you fit different types of work / steps of work to technology vs. human options? Participants: John DeNero (Lilt), Anand Kulkarni (Crowdbotics), Joe Reisinger (Facet) direct link
Measurement and Optimization Measurement and data are the lifeblood of any company, human+computer hybrid systems only make measurement more difficult - because the strategies for measuring technical and human systems can be so different. What seems to work for measuring AAI systems, and what doesn’t? Participants: Andrew Kortina (Fin), Pratyus Pratnaik (Spoke), Ted Schwab (Babylon Health) direct link
Privacy and Security Broadly the panel will focus on privacy being a hot topic across the technology world today, but AAI systems make things even more challenging – because fundamentally there are people and machines touching user and client data in different ways. Participants: Shubham Goel (Affinity), Bryan Mason (VSCO), Yasyf Mohamedali (Karuna Health) direct link
Investing in AAI Service businesses are traditionally difficult for venture investors to get excited about - they are harder to scale than pure technology and frequently have lower margins… Hear from a panel of investors in AAI companies on what they look for / what worries them and how they approach the market. Participants: Max Gazor (CRV), Annie Kadavy (Redpoint), Renata Quintini (Lux Capital) direct link
Business Services A series of AAI companies are taking on a range of corporate departments / roles…ranging from recruiting, to sales lead generation, to legal - hear from a set of companies looking at using AAI to replace or augment corporate departments beyond customer service. Participants: Boaz Hecht (ServiceNow), Genevieve Lydstone (Fetcher), Alex Nucci (Blanket),Tyler Willis (Unsupervised AI) direct link
Customer Service In many ways, customer service is the first place AAI has come into play – it may be the first great use-case. Hear from companies focused on AAI and customer service. Participants: Mikhail Naumov (Digital Genius), Brittany Roderman (TaskUs), Josh Wolff (ThirdLove) direct link
Productivity Many AAI companies are creating / targeting services around increasing productivity of office work, or offloading specific repetitive knowledge work tasks done by white collar workers- hear from a set of companies about what works / does not work in AAI productivity. Participants: Tripty Arya (Travtus), Corey Breier (Invisible), Barron Caster (Rev), Jay Srinivasan (Spoke) direct link
Healthcare Healthcare is an interesting area for AAI where many great companies are sprouting up. Hear from leaders in the space looking to apply AAI techniques to lower the cost and improve the quality of health services. Participants: Joe Kahn (Karuna Health), Amar Kendale (Livongo), Noga Leviner (Picnic Health) direct link
Tools One of the deep challenges of building in the AAI space is that most people end up needing to build many systems alone - the tool-chain of AAI services is still developing and young compared to pure technology. Hear from builders that are trying to provide tools to AAI companies. Participants: John DeNero (Lilt), Kevin Guo (Hive), Eswar Priyadarshan (LivePerson) direct link
– Sam
Why You Need to Invest in Analytics Before You Invest in RPA // 24 Feb 2019
In the last two years we have started to see the dramatic rise of RPA (Robotic Process Automation) in the enterprise. Companies like UIpath, Blue Prism, Work Fusion, and Tonkean are enabling companies to build ‘bots’ to perform routine tasks and focus team members on the most important human work.
RPA is clearly the ‘practical’ future of automation in the workplace. The leverage that companies are getting out of being able to ‘script’ the rote parts of their human work, and focus their knowledge workers on the most impactful work is demonstrable and meaningful.
The challenge in implementing RPA, is knowing what to automate, and how to automate it, and then understanding the ROI of your investment
Measure Before You Start Automating
You can’t start down the path of using RPA until you know what to automate. And you can’t really know what to automate until you understand in detail what your teams are spending time and effort doing.
Until you have that insight you cannot properly decide where to invest in automation, and then understand the impact of the automation you build.
As of today, almost no companies actually have this knowledge - because human knowledge work is notoriously hard to measure. That leaves really only two paths:
Option 1: Implement RPA without insight into your existing workforce
Many companies are doing just this - skipping analytics and jumping right into RPA. This is not advisable. It makes it impossible to know whether or not the effort you are putting into RPA is being well spent, and impossible to know after-the-fact if your investment truly paid off.
There is enough excitement about RPA that many orgs go down this path in the short-term… but without data to support that the investments being made in RPA are the right ones and understanding the impact of work, this is not a great long-term strategy.
Option 2: Do Time and Motion Studies with Consultants
Major consulting firms have been doing time-and-motion studies for decades for large enterprises. For six or seven figures, a great consulting firm will send people to watch and document the operations work of your company and give advice on where automation should fit.
This is better than doing no measurement at all, but this is an antiquated approach to solving the problem.
At best, this approach gives you a small sample of the work being done / consultants can only study a subset of your population. Because it is largely manual work, it doesn’t scale well for followups, and often misses important nuance.
Fin Analytics: The Solution for Measurement to Enable RPA
Fin Analytics is a tool specifically designed to measure Human Knowledge Work. Similar to how Google Analytics and Mixpanel turn marketing into a science rather than a guessing game, we take the ‘black box’ of what happens on human operations teams and make it into clear and actionable data and insights.
The tool is a small plugin that runs on each computer that your team uses for human operations work. It logs full video, an action stream of every scroll-click, etc. that each person does & optionally things like system audio and microphone for phone calls.
The data is all streamed back to your Fin Analytics dashboard, where you get the ‘game tape’ and a powerful dataset of all the operations work being done at the company.
Our data gives you the deep insights to know exactly where time is spent, what leads to mistakes, etc. that you need to know in order to make decisions about where to implement RPA. You can understand and aggregate every action in every task rather than taking a sampling.
Video lets your engineers and process managers go beyond the data, and get a first-hand sense of exactly how work was completed. Just like NFL game tape - your leaders, just like coaches - can rewind and analyze work on the ground to get a full sense of what happened.
Fin Analytics helps you coach your team better with specific and personal examples. It helps you understand and debug process - it demonstrably drives quality and efficiency of work - but for those interested specifically in RPA the payoff is several-fold:
- Get Ground Truth: Fin Analytics shows you exactly where effort is going on your operations team, so you know where to automate.
- Know How To Build: Fin Analytics helps you know exactly how to build your RPA process. Your leaders can easily replay on-demand on-demand at multiple times speed the process steps you want to automate - so you do it properly the first time.
- Measure ROI of Automation: Fin Analytics gives you a clear sense of the payoff from automation - where it is working and where it is not. Rather than relying upon abstract ‘outcome only’ metrics, FA gives you the process information to know where your RPA is speeding you up, and precisely by how much.
Conclusion
We believe in RPA as much as anyone. It is the future - but as happens frequently when the future is near, the mistake is to jump forward without the data and insights necessary to jump forward ‘well’.
Before you and your team invest deeply in RPA, reach out to us at Fin and we can help you instrument your knowledge work so that you get the most out of it.
– Alec (?)
CX and Ops Teams Need Full Funnel Metrics // 18 Mar 2019
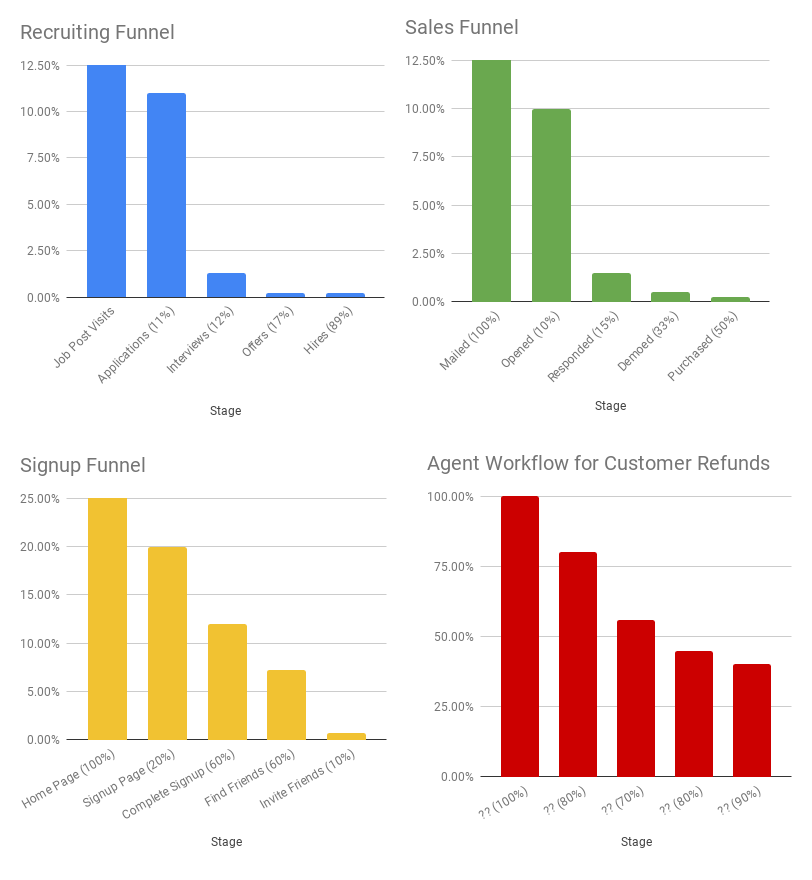
Example funnels for recruiting, sales, and consumer web signups. Most ops / cx workflows lack these kinds of metrics.
The shift from local to online ‘front of house’ work is still happening
While there is much hype around the opportunity for automation of queue based knowledge work (RPA, self help chat bots, automated triage and routing, etc), the reality is that there is an increasing need for high quality, more efficient ops and customer support staff.
This stems from the fact that more and more retail and service business continues to move (and will continue to move) from physical world stores to online and mobile experiences.
Look back ten to fifteen years, and consider the number of services which you might have engaged in online or phone-based customer support: your bank, your cable / internet provider, maybe some travel services occasionally.
Today, consumers look to tech-enabled services as cheaper solutions to many of the things they would have gone to a local shop for in the past.
A huge percentage of shopping (groceries and staple goods, clothes, electronics) has moved online.
There’s a proliferation of local transportation services (ride sharing, bike shares, scooter shares, etc).
There are online marketplaces for finding rental homes, service providers, dentists, doctors, massage therapists, accountants – you name it..
Before these businesses moved their main storefronts online, there were a huge number of local front desk jobs across a number of industries.
Now, the ‘front desk’ is a CRM like Zendesk, Salesforce Service Cloud, Intercom, or one of any of a number of other services (the sheer number of options should give you a sense of the demand for this type of labor).
And, to quote Jeff Bezos, customers have “ever-rising expectations” for the quality of online customer experiences (across all channels – email, chat, mobile, etc).
There’s a surprising lack of deep analytics for this type of work
Online businesses use tools like Google Analytics and Mixpanel to instrument the sh*t out of their customer interactions and they have deep insight about every step of the customer journey. They always understand the next step of the funnel where they have the biggest opportunity for removing friction and increasing overall conversion rates.
But, the principal metrics that even the biggest and best operations and customer success orgs measure are just results metrics and high level KPIs: CSAT, NPS, Handle Time, Close Rate, and a handful of others.
This is the equivalent of the e-commerce era when all you measured was conversions and had no funnel metrics. In this kind of world, the ops leader can at best provide a depth of coaching comparable to asking the team to “score more touchdowns” next week.
We built Fin Analytics to close this gap
When we were scaling the ops team behind the Fin executive assistance service across San Francisco, Phoenix, and the Philippines, we were running a relatively expensive service for customers with incredibly high demands for quality, so we had lots of pressure to constantly improve both the efficiency and quality of our cx team and support operations.
We developed the typical scorecards that defined success, but for a long time felt there was a gap in our coaching.
Eventually, we developed a full stack measurement tool, which recorded screen video and system / mic audio for every working hour, every URL and resource visited, and all of the active and idle time for each team member.
Mapping data from Fin Analytics to outcomes data (problem cases, agents with low CSAT or high handle time) allowed us to understand the full agent behavioral funnel and helped us prioritize the highest leverage changes to our process, coaching, and tools.
We were able to understand which resources were useful, and which were useless.
We were able to understand the workflows that made our best people the most productive and least prone to error.
We were able to have specific conversations with agents about examples of mistakes, instead of rehashing the same abstract scorecard in weekly one on ones.
We were able to develop a video catalog of best practices and ‘plays of the week’ for each workflow.
In summary, all of this extra data vastly improved the picture of the work happening on the ground for our ops leaders, process managers, and QA team, and it vastly improved the conversation between these stakeholders and the agents on the front lines.
Try it out
If you’re an ops leader and this story rings true, please reach out – we’d love to chat.
– Alec (?)
Creating Metrics for Diverse Workstreams // 26 Mar 2019
With automation on the rise, we’re seeing a shift in the way knowledge work is handled. Software allows us to create tickets and measure the time taken on each. It can generate and send automatic responses for common questions, categorize and triage work, and generally enable agents to spend less time on the rote parts of their job and more time on the ‘human’ side; navigating nuanced requests and performing work that requires judgment and empathy.
The expectation to move quickly and efficiently through multiple systems, master all methods of communication, and focus entirely on more high-touch work has increased the complexity of the customer support role.
How do you measure and optimize such a diverse set of workstreams?
It can be challenging to determine the ‘right’ metrics by which to measure your operations team. CSAT, Handle Time, and Ticket Volume only provide a glimpse at the full story, leaving employees frustrated when these limited metrics don’t accurately reflect the level of work performed, which further dilutes the efficacy of 1:1s and coaching sessions as trust in ‘management’ and ‘the system’ degrades.
This problem resonates heavily with SMBs in ‘growth mode’ where their operations team is likely not yet large enough to be specialized, so agents end up taking on more roles than they imagined. Add in the challenges associated with training and retraining employees on ever-evolving systems and policies, and an operations team may quickly find itself under tremendous stress it’s unprepared to manage.
We faced this challenge when growing Fin Assistant. Running a personal assistant service that promised to do anything our users asked meant our operators were expected to handle a diverse range of tasks that might take anywhere from 5 minutes to months to complete, all while providing extremely high quality results and support throughout the entire interaction. Because our customers had very high expectations for both speed and quality, we were constantly focused on improving the quality and efficiency of our service, and finding a concise set of metrics to ‘guide’ our team was key.
How did we determine the ‘right’ metrics for speed, quality, and efficiency with Fin Assistant?
-
It was critical to know what we were measuring before we could do anything useful with our measurements. So, operators (and eventually computers) would tag every contact session with a description of the required workflow(s) based on the context of the request and work that would be required to complete it.
-
We measured everything. We collected a rich data set for all work performed (resources used, time-on-page, time-within-fields, clicking, scrolling, typing, etc.) and then aggregated that data into clear pictures of operator performance, task performance, and even sub-task performance.
-
With that data we were able to generate baseline expectations for every component of work being performed.
-
This then allowed us to normalize operator performance across the types and volumes of work they performed so we could hold everyone to the same concise set of metrics, despite operating across wildly different tasks on a given day.
For example, when creating a metric for speed, we threw out the one-dimensional model of ‘Tickets / Day’, instead looking to our historical handle time data (collected from thousands of successful repetitions across each category of work) to generate expectations that ‘Scheduling a meeting’ probably shouldn’t take more than 15 minutes, ‘Planning a weekend in Italy’ shouldn’t take more than 3 hours, and so on…
We were then able to measure the team based on the percentage of contact sessions that were completed within the unique time expectation associated with the appropriate workflow, allowing us to implement a single unifying ‘speed’ metric that could be fairly applied to any agent: % Contacts Done Under Time Estimate.
This top-level metric still holds people accountable to operating with efficiency while remaining cognizant of quality, and flexible to fluctuations in workloads, but it also replaces the need for dozens of categorically-dependant ‘speed’ metrics. (Those metrics still exist, and are useful for debugging low performance at the top-level, but they’re not useful to show to every agent on a daily basis.)
Once you understand the flow of work within your systems and across your operators, you unlock the potential to create much more realistic and engaging metrics to guide your team and decision making.
Start gathering the data you need
Fin Analytics provides the data and optics operations leaders need to completely understand the work their teams are doing and generate agreeable and effective performance metrics. To get started with a free trial of Fin Analytics, sign up here.
– Alec (?)
Driving Success Metrics with an Operations Flywheel // 16 Apr 2019
Fin Analytics is a toolkit we developed over the course of years experience running an on-demand executive assistance service. We came from a consumer technology background and were surprised by the lack of analytical tools when we entered the domain of human operations knowledge work.
In consumer tech, marketing, and engineering, there are sophisticated tools–like Mixpanel, Google Analytics, and New Relic–that help you find the biggest opportunities for driving change in the high level success metrics you care about. We found nothing like this in the world of human operations, so we built Fin Analytics.
The playbook we used to drive continuous improvement in the success metrics for the human operations team behind the Fin Assistant service consisted of a ‘flywheel’ process: (1) Identify Outliers, (2) Perform Root Cause Analysis, (3) Discover Correlated / Funnel Metrics, (4) Drive these Funnel Metrics with changes to process, coaching, training, tools, or automation.
Our approach was informed and inspired by the instrumentation / profiling process for debugging a broken or slow piece of software.
0. Define Success Metrics
Most operations teams (especially front office teams) have a relatively standard set of KPIs or high level success metrics. These include some sort of metric to capture the quality of customer experience like CSAT or NPS. There are latency metrics like Resolution Time and Wait Time. And there are efficiency metrics like Avg Handle Time and Close Rate for individuals and for teams.
CRM software services like Zendesk provide comprehensive reports of these standard high level KPIs, which answer questions like:
- How is your organization doing this quarter vs last?
- How are the holidays affecting customer wait times?
- Who on your team needs help and training?
What these high level KPIs do not tell you is:
What is the next best tactical opportunity to drive improvement in your organization?
You are left in a state equivalent to knowing that your iOS app is slow or the overall conversion rate on your checkout is 20%.
What you need to prioritize what to do next is a map of root causes and agent behaviors behind the high level metrics you care about. Fin Analytics is a profiling tool designed to give you this information about how to prioritize where and how your organization should invest in the next set of improvements.
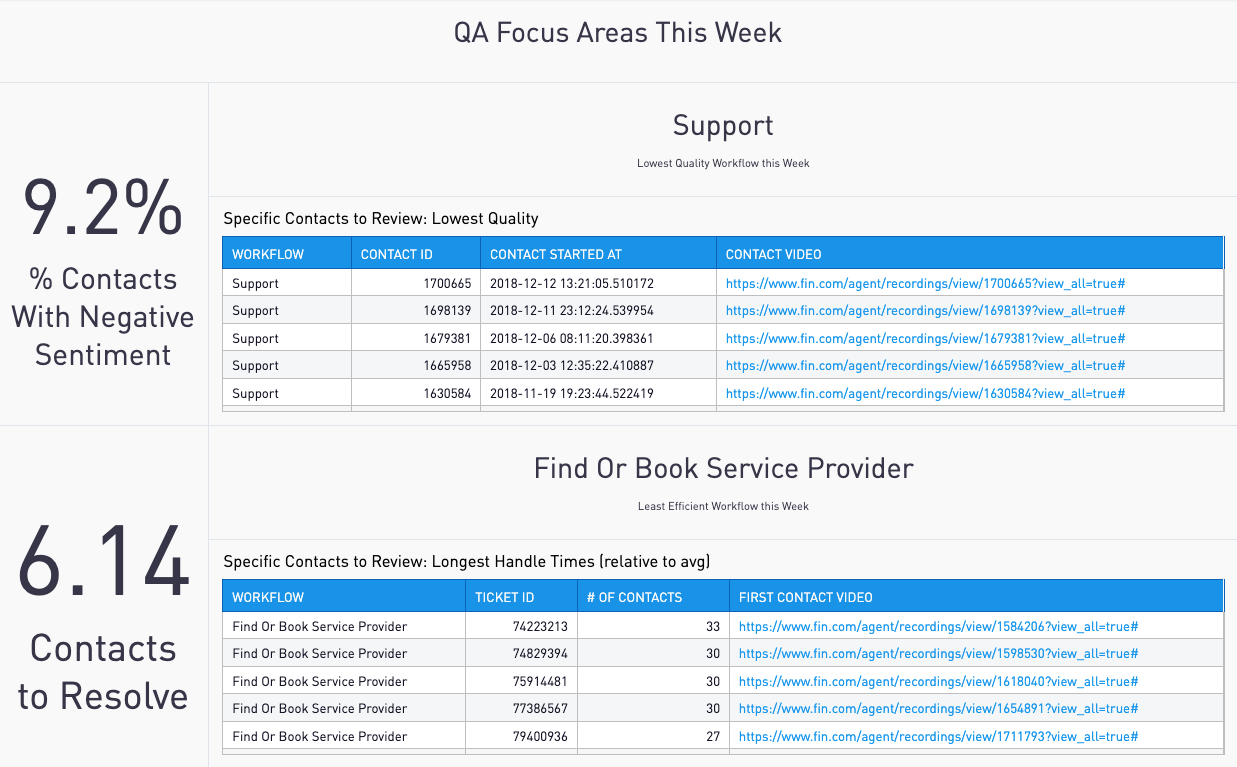
Here is the process we have seen work over and over for using deep analytics to drive high level performance improvements in operations organizations:
1. Identify Outliers
First, identify outliers. Our pithy anecdote about operational metrics is that:
Averages are not that useful. In complex systems comprised of diverse actors, it’s all about distributions.
Averages might tell you that your team is doing better (or worse) this week compared to last, but they don’t tell you why.
Slicing data across dimensions (like agent tenure, workflow type) and then looking at distributions and outliers is the first step to understanding the problem.
Once you have segmented your data, identify the outliers relevant to the high level KPI you are analyzing.
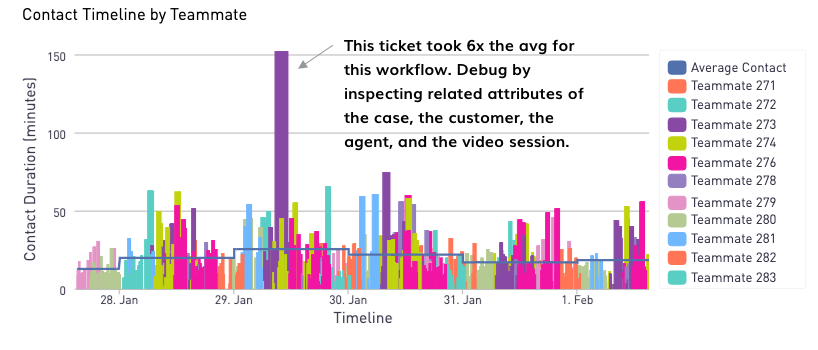
For efficiency problems, this might be tickets that took >2x the avg handle time for tickets of a certain case type.
For quality issues, this might be looking at tickets where customers gave a low score on a CSAT survey.
2. Perform Root Cause Analysis
Once you have a set of specific outliers, you can compare them to the normal cases and form hypotheses about the root cause of a problem:
- Is it because of an update you made to your internal tools?
- A new process rolled out to handle a particular workflow?
- An incoming class coming online that shifted the average tenure of your agent population in a meaningful way?
You may be able to use pure quantitative analysis to confirm some of these hypotheses (for example, a change in average agent tenure affecting top level metrics). But often, the data alone does not answer the question.
This is where qualitative analysis is helpful.
Why did a certain ticket take 40 minutes to complete when the average for that ticket type is 10 minutes? If the answer is not in the data, you might look at the CRM artifact (ie, the transcript) to try to reverse engineer things, but this also often does not shed any additional light on the problem.
This is exactly the scenario where full workday screen recordings are incredibly helpful. With Fin Analytics, you can just search by ticket id to find all instances where that ticket was worked on, and watch the ‘play by play’ of how each agent handled the ticket.
You can see things like:
- The recommended resource or process was out of date, unclear, or incomplete.
- The agent did not follow the recommended steps for solving the problem.
- The agent second guessed their answer and rewrote the response to the customer several times, but the first version was just fine, and they could have saved 10 minutes by having more confidence in themselves.
- The internal tools the agent used were broken or slow.
- The agent asked the manager on call for help on Slack and had to wait 10 minutes for an answer.
None of these root causes will show up in out-of-the box CRM metrics, so most teams resort to periodic agent shadowing to uncover these problems; however, this (1) is incredibly inefficient, because you spend most of the time reviewing the average case vs the outlier case and (2) introduces a ton of lag into process change because it’s happening periodically, not as part of a realtime feedback loop.
3. Discover Correlated Funnel Metrics
Once you have identified the root cause,the next step is to figure out how to measure the correlated behavioral patterns to the outcomes you want to encourage or prevent.
This might mean tracking things like:
- Does an agent consult the correct resources when handling a ticket of a certain type?
- Is each agent using all of the time saving internal tools available to them?
- Are agents making use of canned responses at every available opportunity?
- Are you measuring agent attributes for case types with high variance (eg, correlating agent tenure to CSAT or handle time)? Should you be incorporating these attributes into your work routing?
- Do all of your case types and scenarios have workflows and playbooks?
4. Drive Funnel Metrics
Once you have identified the root causes and the metrics to track them, there are a few types of changes you can make to drive these in the right direction (and consequently drive the top level KPIs they funnel into):
- Process Change. The root cause of high variance in a workflow (or ticket type) might be incorrectly bucketing 2 distinct workflows into just one–so, you need to correctly break this into 2 distinct workflows, each with its own explicit instructions. Or, maybe you just need more coverage of canned responses for scenarios within a workflow. Or, maybe you need to lower the latency of the floor manager’s response time to help line agents.
- Coaching. Operations work is ‘human-in-the-loop.’ Even with the best tools and processes, the best people can still make mistakes. This can happen even with veterans. Maybe they are accustomed to doing things the way that was right 6 months ago, but need to update their workflow to take advantage of the latest process and tooling.
- Training. In high growth companies, ops / cx orgs might be onboarding new classes of dozens of agents every week or two. You might double your workforce in less than a quarter. With a large percentage of low-tenure agents (and perhaps a large number of first time managers and trainers), it’s incredibly important to measure training practices and ensure training process is constantly improving. Every agent class should have a shorter ramp time to reach the expected quality and efficiency KPIs (their performance curves should asymptote earlier and earlier in their tenure).
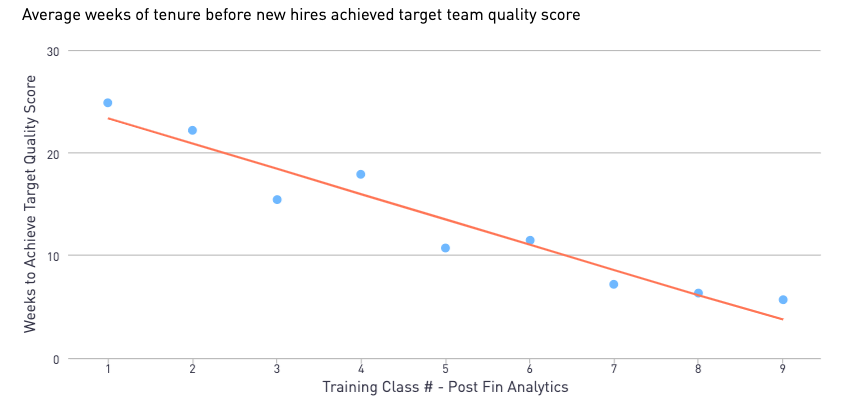
- Tools. Even for teams using an out-of-the-box CRM like Zendesk, agents often use internally built admin tools to access and manipulate customer data (eg, for looking up orders or processing refunds). Watching video of tools usage may reveal critical bugs or severe usability issues that agents must work around in every case or in edge cases. Recording full video streams means your engineering team can debug these cases without wasting ops’ time asking them to reproduce bugs.
- Automation. Video and activity patterns can also reveal opportunities for automation or partial automation. On the spectrum of full automation might be a heuristic for auto-approving refunds based on certain attributes of a customer or of an order, totally bypassing human agent interaction. Partial automation might entail better canned responses that templatize dynamic data about a customer or order, or browser plugins or tools improvements that reduce 10 clicks to a single click.
5. Rinse and Repeat
After fixing the biggest opportunity–just as with performance profiling in software engineering–the next step is to rinse and repeat. Find the next highest variance workflow or set of outliers, and repeat the steps of inspecting these outliers, identifying the root causes, developing correlated funnel metrics, and driving those metrics with changes in process, training, or tools.
Takeaways
If this ‘flywheel’ process for continuous improvement sounds like what your organization wants to do more of, please get in touch about starting a pilot of Fin Analytics!
– Kortina
Agent Metrics Overload: Scorecards, Focus Sprints, and All-Stars // 06 May 2019
The longer you run an operations team, the deeper becomes your understanding of customer needs, the types of tasks your team most frequently handles, and the most common sources of mistakes and inefficiency. On the one hand, it is important to constantly develop metrics to track discrete root causes so that as an organization, you know where the biggest opportunities for improvement lie. On the other hand, it can be overwhelming as an agent on the front lines to have dozens (or hundreds) of metrics to keep track of. In this post, we’ll discuss 3 techniques for managing “agent metrics overload” – scorecards, focus sprints, and “all-stars.”
A Monotonically Increasing Number of Metrics
Before we talk about ways to address agent metrics overload, let’s first discuss how we end up there.
When customer support operations is small–with only a handful of people (or perhaps just one person) on the team–the team might not have any metrics at all.
Probably the first metric introduced is some sort of wait time SLA–you don’t want customers to wait more than 1 business day for an email response, for example. This might be particularly important when the people on the team are also serving in other roles.
Once the team grows large enough to require a dedicated manager and trainer for the CX ops agents, you need more metrics to ensure that training is effective, to have confidence that people are learning how to get customers to the right answers in an efficient way, and to ensure that everyone on the team is doing their fair share of work.
So, you start adding quality metrics like CSAT or NPS, or efficiency metrics like tickets per day or average handle time.
As the team grows larger, you may discover metrics that are early indicators of potential mistakes or metrics that correlate to your top level quality or efficiency goals: for example, you might learn that customers are more satisfied and your team is more efficient when cases are handled in one shot. So, you add a “first touch resolution” metric for the team and a “close rate” metric to incentivize each person to finish every time they touch a case.
When you have some cases that require multiple touches by multiple people, you start needing more nuanced ways to assign responsibility: when 3 different people work on a case and a customer complains about it, who is ultimately responsible?
Before you know it, you might have dozens of metrics that you are looking at to try to understand what is going on, and there are far too many numbers for an agent on the front lines to keep in their head while their primary focus should be helping the customer at hand.
Agent Scorecards
One of the most common ways to simplify metrics from an agent perspective is with a ‘scorecard.’ This is a stack ranked list of 3-5 metrics (many would say 5 is too many) that agent performance is measured by. A sample scorecard might be:
- CSAT: Goal 90% (no less than 75%)
- Avg. Handle Time: Goal 10mins (no more than 15mins)
- Close Rate: 90% (no less than 75%)
There may be other things your org cares about that the best agents will score better on, but the scorecard is the official set of performance metrics that determine things like bonuses (if you do them) or performance improvement plans (for those that do not meet thresholds).
It is important to stack rank the metrics on the scorecard, because they may trade against each other (eg, quality of work vs speed of work). For an agent that is failing to hit multiple metrics, coaching would focus on the most important metrics first: eg, “Your CSAT and handle time are not yet where they need to be, but let’s focus on getting your quality to the baseline level first…”
Since there is limited space in the scorecard, depending on the needs of your organization, you can rotate what is on there to emphasize shifting priorities. In a quarter where you expect user growth to exceed your ability to hire and train quickly enough, you might, for example, choose to sacrifice a bit on quality and emphasize efficiency. Likewise, you might do this during the holiday rush, at an e-commerce company.
Perhaps in the quarter leading into the holiday rush, you are increasing your staff and focused on training, in which case you might remove or relax efficiency metrics, and focus on quality metrics more heavily.
The scorecards give you (and agents) the freedom to keep around as many metrics as you want, but get alignment across the entire organization about which metrics are the most important at any given time.
Focus Sprints
When supporting products with rapid growth or products undergoing rapid feature changes, “training” is not a static period limited to new hire onboarding, but an ongoing process. There are new bugs popping up with new policies for directing customers to the fixes, new types of customers, new customer facing product features the team needs to understand and be able to explain, or new internal tools intended to make the CX ops team more effective.
Often, simply informing the support team about the latest tools and policies is not sufficient to get the new knowledge to retain–your team will (rightfully) be focused on the performance metrics they get scored on.
One technique for driving adoption of new policies and tools is the “focus sprint,” which introduces a transitory metric that measures whatever sort of change you are rolling out.
So, for example, suppose your team just transformed the entire knowledge base for handling the top 20 types of cases into canned responses available through your CRM. Just telling people that the canned responses exist might get a few people using them, but most people will more likely than not stick to their routine style of handling cases in the way they know best. Perhaps even your most efficient people are resistant to the change, because, after all, they know the process well and are pretty efficient at it. But, if you are confident your canned responses will save time for even the best performers and help ensure consistency across your entire org, you would want them to use the canned responses as often as possible.
So, you might introduce a “focus sprint” metric of something like Percent of Cases Handled with a Canned Response, setting some sort of target adherence threshold. You could leave this metric in place for about 2 weeks, until you are sure everyone has tried out the new tool live and understood how it works, when to use it, etc.
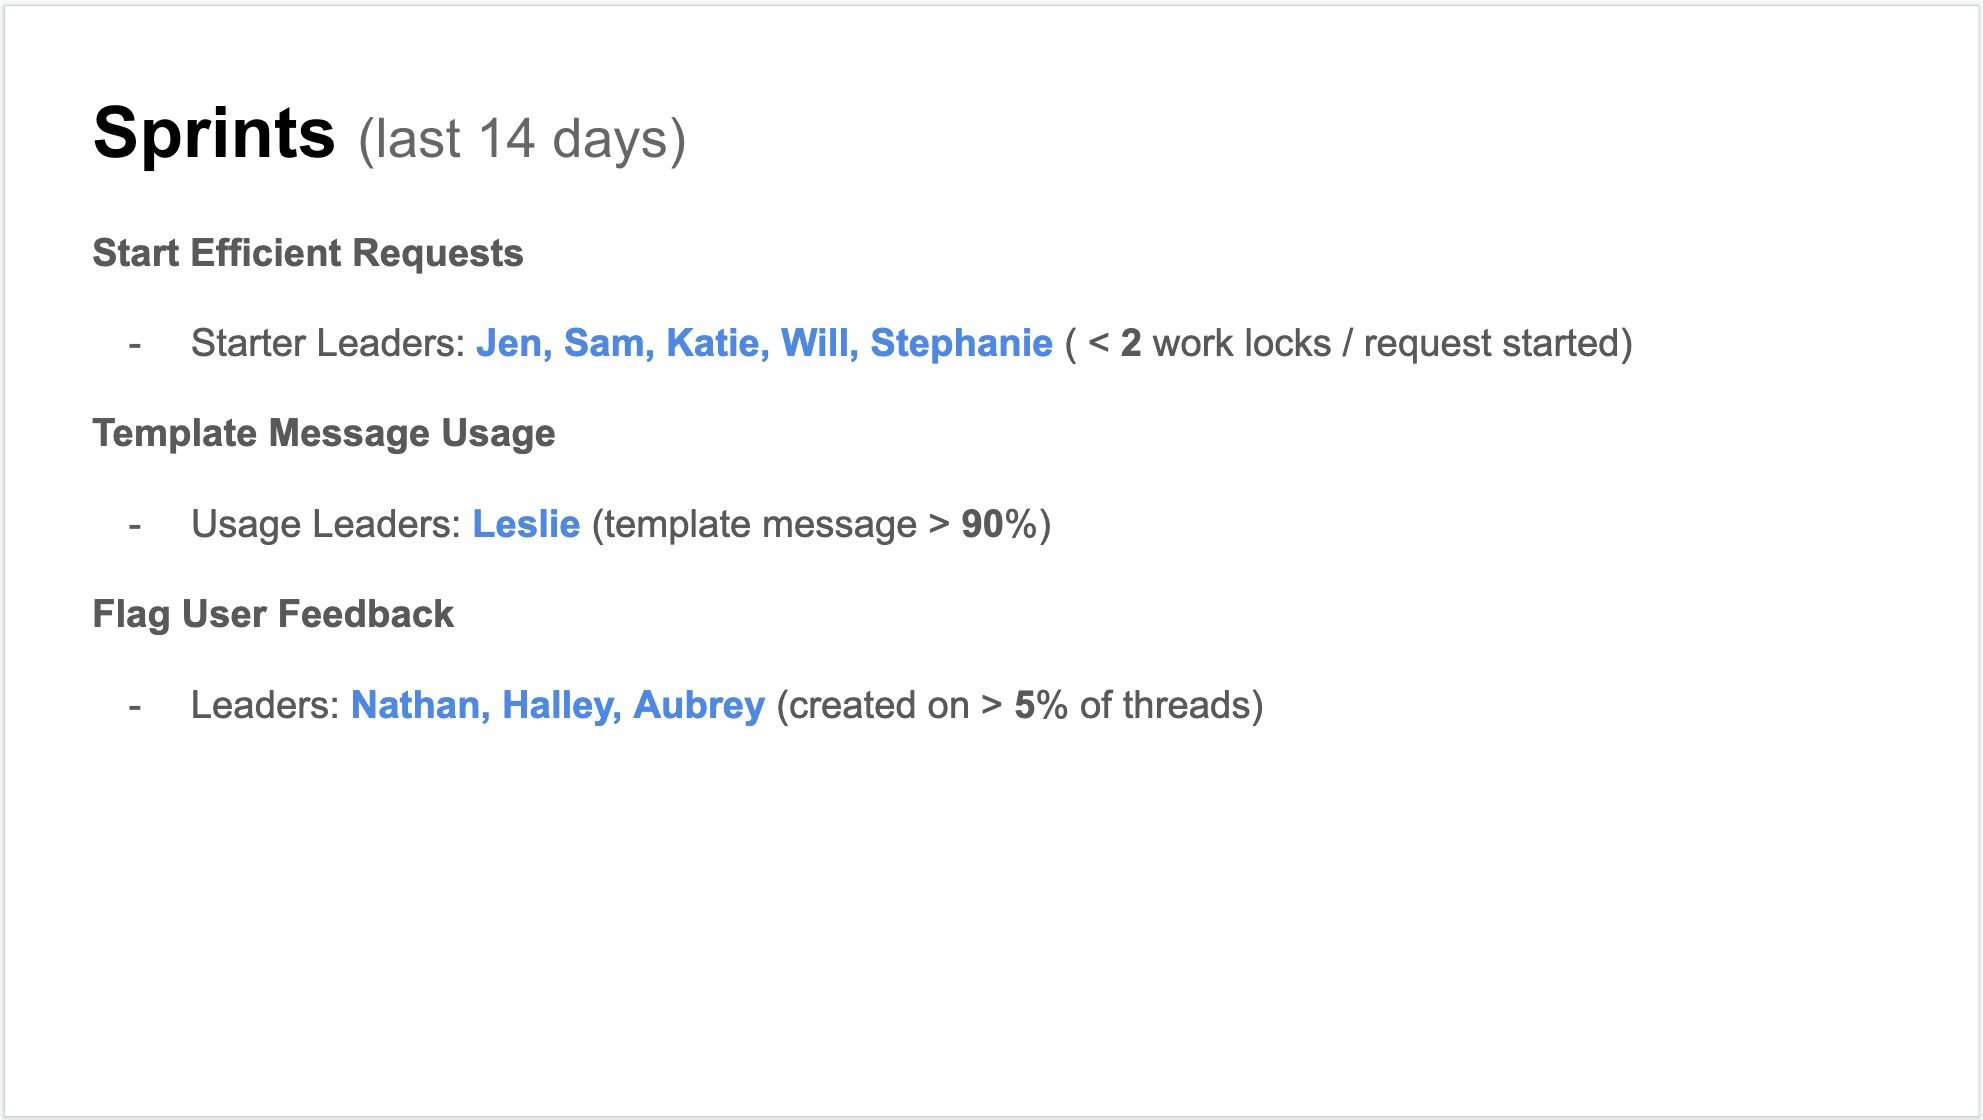
In organizations where lots of change is happening within the quarterly schedule, these kinds of sprints can be crucial for ensuring the entire team is up to speed on the latest and greatest best practices.
All-Stars
In the score card section, we discussed the importance of stack ranking metrics from most important to least and having your team focus on the most important metrics first.
But really, all the metrics on the scorecard (as well as a bunch that are not on the scorecard) are important, and it would be nice to have the best performers incentivized to perform at a higher bar than simply satisfying the baseline thresholds for the handful of most important metrics.
A really cool concept we had when running the ops team behind the Fin Assistant service was the “All-Star.”
Each week, at the team all-hands (as well as in a weekly email that went out to the entire company), we announced the Stars and All-Stars for the week. Stars were broken out per metric category on the scorecard, and were awarded to those who exceeded the goal number (not just the baseline threshold) for that metric.
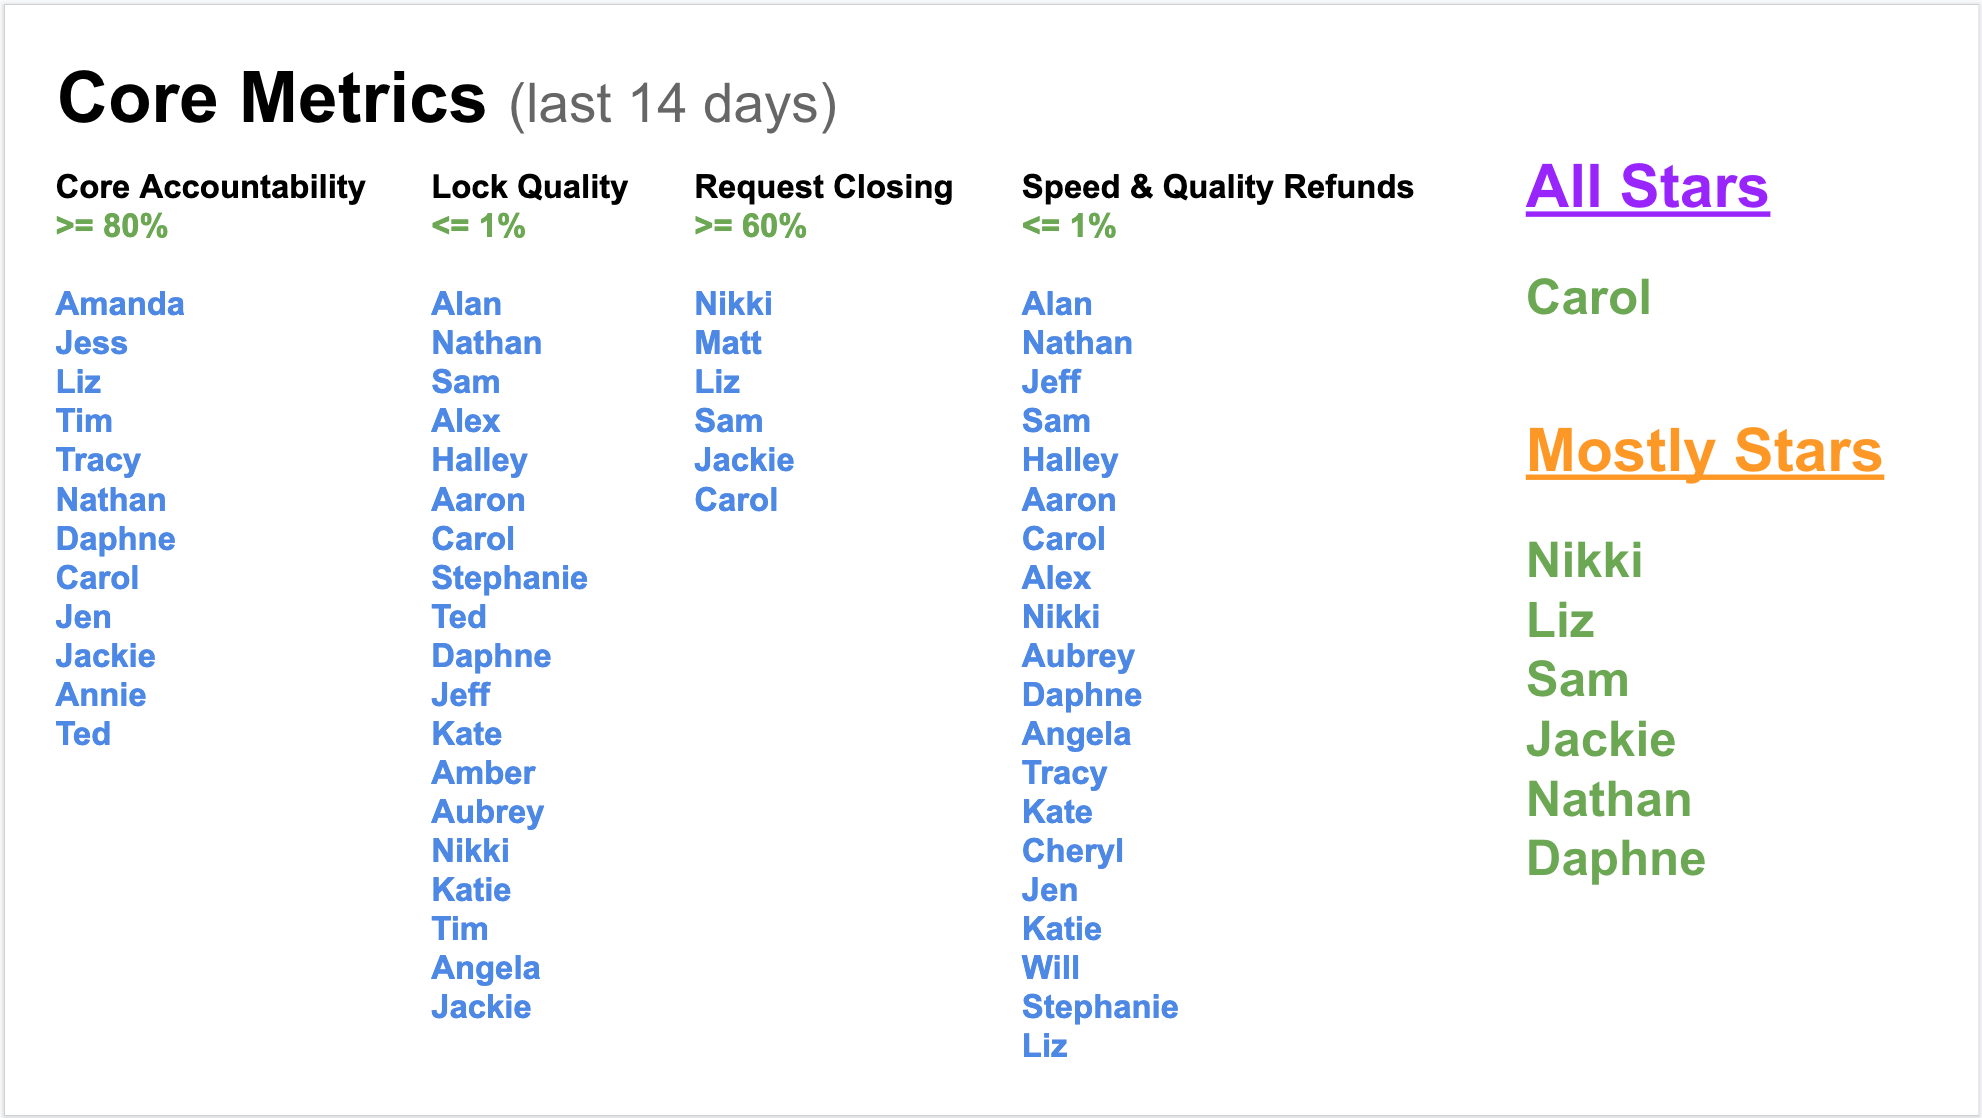
Almost everyone on the team would hit the Star level for a particular metric in various weeks, and this was a particularly nice form of positive recognition when someone who had been struggling in a category mastered a particular area of struggle. (Michael Jordan’s eventual achievement of defensive player of the year after receiving coaching feedback that defense was the week spot in his game comes to mind.)
All-Stars hit the Star level for every metric on the scorecard, as well as the focus sprint metrics for that week.
Since these metrics often traded against one another, it took a great deal of skill and judgment to achieve the All-Star score. There were only a handful of All-Stars in any given week, and they were called out one by one and celebrated by the entire company.
Finally, for those that made the All-Star list every single week of a quarter, they received an All-Star Quarter award. This was really challenging and only a handful of people in the entire history of the program received this award.
Takeaways
When balancing customer satisfaction with organizational efficiency, you’ll inevitably end up with tons of different metrics you use to understand and diagnose all sorts of problems. Often, these metrics can be overwhelming or seem overly focused on preventing negative outcomes to agents on the front lines. We found that using agent scorecards and focus sprint metrics help agents deal with metrics overload, and developing an All-Star recognition program is a great way to give positive, public recognition to the best performers on your team.
– Alec (?)
Get the Rest of Your Org on the ‘Front Lines’ with Your CX Agents // 13 May 2019
Fin Analytics provides a few different key data assets: (1) It gives you individual and organizational level browsing data, which you can use to understand the complete set of resources your team uses, inside and outside of your core CRM and admin tools. (2) It also provides you a full screen video and audio stream for all work done by your team.
Making use of the time spent / browsing data is fairly straightforward, but we get lots of questions from customers about the best ways to make use of this screen video data, so in this post, we’ll talk about some of our favorite ways to use video assets to drive improvement across your organization.
It’s All About Shadowing
One of my favorite conversations I have had with the head of any CX org was with a woman running the customer support operations for a marketplace business. We were talking best practices for scaling ops teams, and she told me that one of the most important policies she implemented everywhere she worked was a quarterly shadowing day mandatory for all leadership.
One of the obvious benefits of this practice is the first hand education of execs about specific problems customers are encountering and the processes and work the CX org is doing to solve them.
I learned one of the less obvious benefits of this practice from talking to the front line agents about why they liked these shadowing days.
In many organizations where the operations team (and individuals on it) measure their performance with a set of metrics, there is a concern from the front line agents that everyone else in the organization–execs, the QA team, managers, engineering–sees them only as a set of abstract numbers.
What many agents love about shadowing is showing other members of the organization the set of problems and frustrations they must deal with every day as part of their job: irate customers, broken or slow tools, inefficient or unclear processes, etc.
Shadowing is a critical feedback channel agents can use to communicate these frustrations to various other members of the organization that can help solve them.
In this post, I’ll talk in detail about several distinct types of shadowing (some of them only possible with Fin Analytics):
- Traditional, In-Person Shadowing
- Reverse Shadowing
- Spot Review Shadowing
- Targeted, Virtual Shadowing
- Eng Debug Shadowing
Traditional, In-Person Shadowing
Traditionally, when people talk about shadowing an operations team, they refer to sitting next to someone and watching them do their job.
While this has the nice benefit of getting you some face time and personal rapport with someone, there are a few major drawbacks:
- You may need to fly to a different state or country, which adds a huge amount of overhead
- You can only shadow at ‘real time’ (not faster than real time)
- You are subject to seeing the random cases that a person happens to pull up throughout the day (vs a more focused subset of cases)
- The agent may behave differently when you’re sitting next to them (eg, your presence may distract them or make them nervous)
Reverse Shadowing
Reverse shadowing is a bit outside the scope of this post, but worth mentioning for the sake of completeness. This is more often performed in the context of training new agents than it is performed across functions, but the basic idea of reverse shadowing is to have the more experienced agent watch and advise, while the less experienced person ‘drives’ the tools and interactions.
Spot Review Shadowing
Many QA teams employ a spot review process, where a team reviews some percentage or number of cases worked by each agent per week or month.
Normally, the spot reviewer has access to a CRM artifact (chat transcript) and maybe a call log if an audio recording exists.
These often, however, do not tell the complete story of why a particular case took 6x longer than the average for the case type. Or, getting to the root cause using the typical artifacts, if it is possible at all, is incredibly time consuming.
One key use of Fin Analytics is super-empowering QA teams with full screen recordings of every agent interaction. Pulling up the screen video and watching it at 4x speed can often be a much more direct path to figuring out where a particular agent got stuck in their process.
Targeted, Virtual Shadowing
In-person, traditional shadowing is pretty much always subject to a random sampling of cases–whatever the agent pulls from the queue next. Similarly, spot reviews are also often randomly sampled. When there is limited QA bandwidth, however, it may be more effective to do more targeted shadowing of specific subsets of cases.
Rather than shadowing completely random cases to uncover process and tools problems, you can target your shadowing sessions to those likely to be correlated with issues: eg, you might choose to shadow:
- only cases where a customer complained / gave a low CSAT survey score
- or, only cases that are the fastest (p95) or slowest (p10) handle times for a particular workflow
- or, only cases from your highest variance workflow
Prioritizing your shadowing time in this way is a far more efficient way to uncover problems than random shadowing.
NB: we only recommend prioritizing your shadowing time when the goal of QA / shadowing is process improvement, not when you are scoring agent performance. When scoring agent performance, we recommend metrics that cover every interaction or a random sample, if you must sample.
Eng Debug Shadowing
A final shadowing case to cover is the shadowing done by engineering teams building the internal tools used by operations teams.
This type of shadowing benefits from the same ability to filter down with Fin Analytics to targeted sessions in the way discussed above.
The additional workflow Fin Analytics enables for this type of shadowing is the bug reporting feature of the Fin Chrome Plugin:
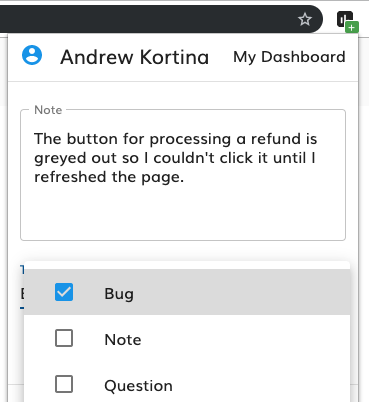
With a few taps, agents with the Fin Chrome Plugin can log a bug that will automatically include the URL they were on when the bug occurred, along with a pointer to their video stream of when the bug occurred.
This means that agents don’t have to waste time going to some other tool to file a bug report, trying to describe in prose the sequence of actions that occurred that led to the bug, or trying to reproduce the bug so that they can record it with some other tool.
This returns tons of time to agents they can use to spend working on customer cases, and the video attachments of bugs ‘in the wild’ give the engineering team an invaluable tool they can use to resolve bugs more quickly for users of their internal tools.
Takeaways
We are huge proponents of shadowing of all kinds as a way to facilitate better communication between front line agents and every other part of an organization. The Fin Analytics video stream opens up new types of shadowing that can dramatically increase your team’s efficiency and pace of improvement in tools and processes.
– Alec (?)
Increase Team Productivity with Comprehensive Process Data // 23 Jul 2019
Most customer support teams use a ‘scorecard’ to track key efficiency (resolutions per hour, average handle time) and quality (CSAT, NPS) metrics for each member of the team. While these metrics are important to understanding outcomes of your support operations, the typical scorecard metrics have a few major limitations. First, these metrics only track results of work that happens in the CRM. Second, none of these metrics tells you why an agent makes the decisions they do in service of a particular ticket (so they don’t reveal the root cause of failures).
Consider these scenarios: an agent may make every ‘right’ process decision during a customer interaction, but then her browser crashes, driving up handle time on the ticket. Or, an agent might get a particularly difficult call which requires him to access several internal docs, ping the manager on call, and navigate around a bug in the CRM, all in the service of one ticket.
Traditional outcome metrics might lead you to conclude that agent is underperforming, with higher than average call times, lower than average calls per hour, and maybe even lower CSAT scores.
In both of these examples cases, however, the agent did their job correctly; these are not a performance problem where the remedy is training or coaching, but process and tools problems. In order to drive the results you care about, it is important to properly attribute root causes of failures like these.
Fin Analytics bridges the operations data gap between specific agent work behaviors and the outcome metrics you care about with new tools for properly attributing the root causes of failure that block your team from doing their best work. Fin logs a full data stream of every action taken and a complete screen recording of each agent’s workday, providing teams with the missing pieces to understand operational processes and spot opportunities for improvement.
Here are a few of the many metrics Fin Analytics provides out of the box, which help operations leaders achieve greater productivity across their whole team:
1. % Utilization. What percentage of an agent’s total day is spent actively engaged and working? Does that track with how much output you see them generating?

2. % of Time Spent in Different Resources. What percentage of an agent’s active working time is spent inside your internal CRM? What docs are they spending the most time in? How much time is spent on Slack each day / week / month?

3. Within each resource, what behaviors are you seeing? What are the most common URLs visited? What is the breakdown of Production (i.e. typing a response) vs Consumption (i.e. scrolling or reading) behavior you are observing within each resource?

Now that you have these new productivity metrics, what do you do next?
Set baselines and observe outliers. Now that you have the measurement in place, you can begin to set productivity baselines for your team, and spot any outliers. With Fin, you can now deep dive each outlier case to pinpoint exactly what went wrong, in negative cases (Was is a broken tool? An outdated process? A result of bad training?). And, you can discover what went well in positive cases (perhaps an agent developed a more efficient way to handle a certain workflow), and then bake this into best practices and training for the rest of the team.
Accelerate your QA process. Video review in Fin Analytics makes QA far more efficient by eliminating the need for manual shadowing, and giving your team the ability to play back any case or moment of an agent’s work day at up to 5x speed. With Fin Analytics, you can also focus your QA team on the most important cases to review - problematic workflows or teams, and the outliers within these segments - rather than reviewing random samples.
Conclusion
Traditional quality and efficiency metrics are valuable indicators of your team’s performance, but can only provide part of the whole picture of the team’s work. Fin Analytics fills the operational data gap with its robust data stream and video recording capabilities, empowering teams to increase productivity and drive toward their goals.
– Alec (?)
How to Choose CX Metrics that Drive Real Business Outcomes // 25 Sep 2019
As a CX leader, you want to create positive customer experiences for your company. But many CX leaders today are not equipped with good enough data or metrics to drive continuous improvement within their organizations. Traditional CX metrics fall short of quantifying the actual impact of CX initiatives, and as such, these initiatives are often overlooked.
In this post, we’ll examine some of the pitfalls of commonly used CX metrics today, and provide a framework for choosing metrics to drive real business outcomes.
Traditionally, the numbers that CX leaders are expected to drive have been things like “Are the customers happy?” and “Is the team running efficiently?” Measuring customer satisfaction and team efficiency are indeed critical, but often the metrics for these don’t directly tie to ROI for the business.
What really matters to the business is customer LTV, customer retention, growing spend, etc. CX can, in fact, have a massive impact on these company-level metrics, but the leap between “Did the customer have a good experience?” to real LTV has historically been difficult.
How to Choose the Right Success Metrics
In order to drive success as a CX leader within your organization, you need to equip yourself, your line managers and your agents with metrics and targets that are attainable and impactful. There are three main properties that all good metrics have:
(1) The number is important to the business and clearly connected to its success
(2) The number is representative of things that are within your control
(3) The number moves fast enough that you can demonstrate day to day, week to week, and month to month the progress of your team
I’d like to use CSAT as one example of a metric which most leaders are using today, to evaluate these principles. CSAT can give you a relative temperature check of how customers feel about the quality of your support today versus a few months ago, but it can fail on all three of these dimensions.
First, CSAT may not actually connect to business goals. Have you quantified how CSAT impacts customer churn, LTV, or increased revenue per retained customer? If not, how do you balance the equation and understand how many dollars to invest in trying to boost CSAT 10 points?
By choosing CSAT as your target metric, you also run the risk of frustrating the individual agents tasked with driving it. CSAT can make sense as an organizational goal, as a greater volume of responses should wash out any variance in customer disposition across agents, but it may not be suitable as part of the individual agent scorecard. It is a subjective customer perspective, which can often have more to do with whether the customer had a bad day, and not how well the agent did his or her job. CSAT is important to understanding how the customer feels about the company, but the individual agent is often many steps removed from that.
Lastly, there can be a real lag with CSAT, and you may need more direct measures of the efficacy of new policies, processes, and tools you are rolling out, that give you faster feedback with less noise. With big data, this is starting to get easier. You can begin to calculate how these things fit together in the longer term, but still CSAT doesn’t tell you in a given month, or even a given quarter, how the work you’re doing today is going to impact the company long term.
How can we align CX metrics with actual business outcomes?
The biggest opportunity for CX leaders will be moving to a world where every day you know if the changes you’re making have a positive and demonstrable impact.
CX leaders today are getting a ‘seat at the table’ to the extent that they can prove the link between the work they’re doing and real business metrics around profitability and retention. The next step is to connect the work of the CX team to a metric that changes quickly, and use it to goal your teams and see the impact of the work you’re doing.
What’s the next step for CX leaders?
Leaders need to set their teams up with metrics that are connected to the business, represent the work that is within the team’s control, and that reflect the impact of changes quickly, both at an aggregate level and on an individual level.
For example, an organization may use Cost per Resolution as its team-wide, company metric, and at the agent level, measure Percent of Tickets Resolved (of the tickets you touched, what percent of them did you close out?) Each agent then has the opportunity to drive this metric with every ticket, while also driving down the Cost per Resolution for the team as a whole. Agents are able to own their performance and see the direct impact for the business.
This is just one example of a metric used to drive business outcomes. On the whole, the more you are able to precisely define the metrics that are under your control, and which also ultimately add up to customer satisfaction and increased customer LTV, the more impact you will have both as a leader to your team, and for your business overall.
– Alec (?)
How to Organize Operational Data for Maximal Insights // 03 Oct 2019
Many operations teams struggle with how to effectively categorize and tag workflows in order to best understand and analyze the data. Depending on the team and the type of work performed, some organizations have just 1-2 tags per task, whereas others have hundreds. What are the best practices for tagging and categorization of workflows? How can we eliminate the ‘noise’ and better understand workflow data?
In this post, we will offer a framework for how to think about categorization and tagging of workflows for maximal insights.
1) Assign each task a MECE category
Mutually exclusive, collectively exhaustive, or MECE, means that each task, conversation, or piece of work your team performs has one and only one category associated to it.
For example, if Refunds are a workflow your team handles, a refund conversation would be tagged as “Refund.” Even though, often a given conversation may have four or five other components involved, you would still only assign it one MECE category.
This kind of forced bucketing becomes very valuable later when you want to analyze the data or look for opportunities across categories and are able to more accurately size and compare them. Without MECE tagging, you’re left with noisy data that is so intersected that you aren’t able to distinguish or add them together to get the overall set of opportunities to then prioritize.
Can this type of forced bucketing create fuzziness in the data? Yes. But the ability to segment and add up your data to identify opportunities is incredibly valuable and eliminates the noise you otherwise get from complex tagging schemes.
2) Only tag what you’ll want to analyze later
This may seem obvious, but very often, operational leaders, in an effort to understand the work being done, stray into a world of too many tags, and subsequently, too much noise in the data. Most organizations don’t have more than a dozen tags or concepts on a given conversation, but some have upwards of one hundred tags for a single workflow. How many tags is too many, or too few? If you find that your organization overall truly has hundreds of tags that are ‘relevant’ you might want to focus on more organizational alignment.
Each organization has different needs and priorities, so there isn’t a single answer to this question, but we can offer a filter to help simplify and clarify the tags you should keep versus pitch. Simply, when setting up workflows and associated tags, ask if these are things that you’re going to want to analyze later. If you end up in a world where you’re spending a ton of effort and time categorizing and setting up data you’re not going to use later, you’re better off not doing it.
Conclusion
Every organization is different and will require a different approach to data categorization, but our recommendation would be to first, employ MECE categorization to your workflows, even though the forced categorization will create some fuzziness in the data, and second, when adding tags and organizing work, aim for enough data depth to allow yourself to analyze what you want to analyze without drifting into a world of spending time on things you aren’t going to use. If you wind up feeling like you need to add more tags later, ask yourself whether that task is too big and can be subdivided into smaller categories that can be more accurately measured.
– Alec (?)
Identify and Prioritize Opportunities for Workflow Improvements // 14 Oct 2019
When thinking about workflow improvements and how to prioritize them, it make seem like the obvious thing to do first would be to either start with the workflow that is most commonly used or has the highest error rate, assuming that change will have the biggest impact on the overall organization.
But, if something is very broken, but only happens 1 in 10,000 times, it probably shouldn’t be the first thing to focus on. Likewise, if a workflow occurs frequently, but is already very optimized, it’s also not the right place to start.
How do you know where the greatest opportunities for workflow improvement exist, and which to prioritize?
In this post, we’ll offer a formula for ranking workflow improvement opportunities, provide a framework for how to size those opportunities using data distributions, and discuss how to measure the impact of changes made.
Prioritizing opportunities for improvement: Size x Frequency x Difficulty
When looking at and prioritizing opportunities for workflow improvement, there are three vectors to consider in making your decision. The biggest areas for improvement can be found at the intersection of size (How big an improvement can you make?), frequency (How often does this come up?) and difficulty (How difficult will it be to make this change?)
These are three key questions to consider when deciding which workflows to work on, and in what order. It may sound obvious, but it’s an important formula to keep in mind, which yields the overall opportunity of the change.
How to size an opportunity: Focus on the P50-P80
When it comes to then sizing an opportunity, we’ve found that averages can actually be very deceptive, as can outliers. If you only look at the averages across your workflow data, the data will always ‘wash out,’ and it becomes difficult to see where opportunities are. Similarly, if you only look at outliers, you may find that your workflow is generally good, but there are a small number of edge cases that were a total disaster (and often for reasons beyond the workflow’s impact).
Rather than focusing on averages and outliers, we instead recommend focusing on the P50 to P80 cases when sizing opportunities.
Anything above the 80th percentile (the longest cases) are useful for other types of analyses, but these are typically representative of the outliers mentioned previously. Instead, ask what the best and worst performance looks like within the P50 to P80 cases, and that delta will be a strong indicator as to where to focus.
Ask what workflows or coaching efforts you can work on to move the P80 to the P50 most efficiently. By moving that distribution over, you will unlock massive efficiency gains for your organization.
Measuring the impact of workflow changes:
Once you’ve made a change to a workflow, how do you measure the impact? First, it’s important to, as much as you are able, hold as many other variables constant as possible. If you improve a workflow, but also change the agents using that workflow, for example, it’s easy to lose sight of the impact the change actually had.
Second, measure work continuously. By analyzing process data, you will be able to see how agents interact with the new workflow, how processes adapt, and whether the change you made is having the desired impact.
Once you’ve held all other variables constant and begin to capture your team’s process data, you can analyze whether the changes you make have a meaningful impact on the team’s averages and outliers, and whether you are moving numbers within the P50 to P80 range.
– Alec (?)
AAI 2019 Conference // 01 Nov 2019
In October 2019, Fin, along with The Information and Slow Ventures, hosted the second annual AAI (Artificial Artificial Intelligence) Conference.
The goal was to provide a lens on hybrid human+computer systems and explore the potential these systems have to drive efficiency within an organization.
Over the course of an afternoon, we held a series of panel discussions with forward-thinking industry experts and entrepreneurs who are developing and using this technology today, and looked forward to the possibilities these technologies hold for the future.
We’re excited to share with you the recorded sessions!
Opening Remarks: AAI Year In Review
A retrospective on what has changed in the last 12 months since our last gathering. What were some of the most impactful AAI innovations and how has the overall landscape evolved?
Speaker: Sam Lessin (Slow Ventures & Fin)
The State of Knowledge Labor
When and how can leaders determine whether to build labor in house, with BPOs, or through a cloud infrastructure? We discuss how the business process outsourcing industry is evolving and where it will go from here.
Panelists: Scott Moran (Go2Impact), Troy Astorino (Picnic Health)
Moderated By: Sam Lessin (Slow Ventures & Fin)
The State of Operations Tools
An evaluation of CRMs, Salesforce Service cloud, Airtable, Zapier, and more. What types of tools are needed, finally good enough to use, and over-hyped for setting up AAI systems?
Panelists: Gerald Hastie (Masterclass), Mila Krivoruchko (Zoom), Peter Kuykendell (Mercari)
Moderated By: Joanne Chen (Foundation Capital)
RPA and Automation
Robotic Process Automation is one area of AI that has proven real traction and product market fit, growing into a multi-billion dollar industry over the last ten years. RPA today is an oligopoly but how has the success of UIPath and Blue Prism opened doors and changed the public’s perspective towards tools for automation?
Panelists: Niladri Panigrahi (V2Solutoins), Sagi Eliyahu (Tonkean)
Moderated By: Sam Lessin (Slow Ventures & Fin)
Next Generation End-User Services
Bots, chat services, and conversational commerce have fundamentally shifted the way people interact with brands and customer service teams. What is the hype cycle around these technologies and what kinds of next generation services are on the horizon?
Panelists: Allen Lee (Symantec), Bethanie Maples (Stanford Human-Centered AI), Phil Gray (Interactions Corporation)
Moderated By: Sam Lessin (Slow Ventures & Fin)
The Startup Path to the Future vs. Enterprise Modernization
The pros and cons as big companies try to modernize vs. new companies spring up. Is it easier to build AAI from scratch or incorporate it into existing systems?
Panelists: Amrish Singh (Metromile), Genevieve Wolff Jurvetson (Fetcher), Russ Heddleston (DocSend)
Moderated By: Jessica Lessin (The Information)
Measurement and Optimization Strategies
The future of operational quality and efficiency in AAI will be supported by continuous process measurement and big data. Given the complexity of measuring hybrid human + machine systems, what are the different strategies for optimizing AAI, what has worked, and what hasn’t?
Panelists: Alex Nucci (Blanket), Sami Ghoche (Forethought)
Moderated By: Sam Lessin (Slow Ventures & Fin)
Fireside Chat: Amar Kendale & Jessica Lessin
Amar Kendale (Livongo), Jessica Lessin (The Information)
QA strategies & debugging people, process, and tools in AAI systems
Computers and code are much easier to debug than people. How can companies use data and analytics to mitigate both human and computer errors.
Panelists: Alex Modon (Omni Labs), Alec DeFilippo (Fin), Lily Chen (Picnic Health)
Moderated By: Andrew Kortina (Fin)
Hope you enjoy the sessions, and let us know if you want to come to the next one.
– Alec (?)
Handling Ticket Outliers in Operational Settings // 06 Nov 2019
On average, the longest 5% of cases consume 20-30% of most customer service teams’ time and engagement.
Time-intensive edge cases are an unavoidable reality for CX teams. In an ideal world, 5% of cases should take 5% of your team’s time. In reality, that is obviously not the case. Customers will have complicated questions, agents will need to take longer on some issues than others, and outliers will always crop up.
The question then becomes, what are acceptable benchmarks for how much time your customer service team should be spending on these outlier cases, and how can you ensure your team’s time and engagement is spent efficiently?
Benchmarks for Time Spent on Outliers
According to the benchmarks Fin Analytics has generated from working with a number of operations teams, 20% of agent time is spent on P95 cases. That is, the longest 5% of cases. This number varies from team to team, but high performing teams typically hover around the 20-25% range.
No matter what your team’s time breakdown looks like, the goal should always be to drive for greater efficiency, starting with eliminating these outliers where possible. So how do you begin to drive that number down?
Identifying Outliers
One of the first things we always do with Fin Analytics customers who want to reduce the cost of time spent on outliers is build a custom QA Review Priority Queue. This is absolutely essential, because if you rely on random sampling, then by definition, only 5% of the cases your QA team reviews will be in the top 5% of slowest cases. Yet, as we have said, these cases typically consume 25-35% of your team’s time, so any insights and improvements you make to this band of cases will have a huge payoff.
We work with organizations to sort their custom QA Review Priority Queue by a heuristics that matter most to their goals, giving higher priority to things like cases with low CSAT scores, cases within the highest variance Case Types, and outlier cases from the p95+ effort band.
Once you have ensured your QA team is focusing their valuable time and effort on the cases that present the biggest opportunities for improvement, the next step is to look for things that the outlier cases have in common.
- Is there a certain workflow that all these outliers are associated with?
- Are certain people setting up tasks incorrectly, causing those cases to take much longer to resolve than others?
- Is there a certain tool that your team is using that highly correlates with outliers?
After you’ve identified a few common root causes across outlier cases, you can start to have an idea of where to focus, and begin to tackle those root causes.
Each CX organization is different, but some of the most common issues we’ve seen driving up handle time are:
-
Workflow Issues. If a certain workflow corresponds with a high number of outliers, you may need to redesign that workflow. Perhaps the workflow can be broken down and simplified, or separated into different queues.
-
Unclear Instructions. A workflow may be undefined, missing templates, or perhaps doesn’t time-box the amount of time agents should be spending, which costs agents time on research and composition, in an effort to be precise.
-
Personnel Issues. If a certain number of people are driving a large percentage of those outliers, it’s worth a conversation to understand why. Front-line managers can shadow work sessions and find ways to help these agents get faster or more efficient.
-
Training. It could be that your team simply needs better training, or re-training, on how to handle certain cases, to drive down handle time.
These are just a few possible causes for why a support case can become an outlier. Realistically, no CX team will ever reach a state where all cases are handled in equal time, but understanding the root causes of these outliers and systematically addressing each contributing factor within your control will make your team more efficient as a whole.
—
For more in-depth reading on how to eliminate outliers to drive continuous improvement, check out our recent post, Driving Success Metrics with an Operations Flywheel .
– Alec (?)
Discovering Best Practices From Your Team // 12 Dec 2019
There is no such thing as a ‘best’ operations agent. In reality, different people are good at different things. One agent might be the fastest at a certain type of task, while another agent sets the bar on quality. And these leaderboards may change from week to week, depending on a number of factors.
As we get more scientific about measuring and instrumenting operations and CX work, we need to let go of the notion of the ‘ideal’ agent, and instead look at these metrics with an aim to uncover individual strengths and weaknesses.
Once you can begin to recognize individual agents for their unique abilities and experience, you begin to unlock opportunities for coaching and improvement at the peer-to-peer level.
How to Identify Top Performers
Identifying your top performers can be hard if you only look at averages of performance statistics, such as number of tickets closed, or CSAT. To get a real picture, you have to cut the data and go deeper to understand who is best at what.
First, you can look by workflow. It’s fairly easy to see by examining the data that different people are differently talented at different workflows. Start by looking at CSAT scores, close rates, first contact resolution rates, or some other outcome metric by agent across different workflows, and you will start to see who is consistently setting the bar for which types of tasks.
Or, to be even more granular in your analysis, look at the data broken out by tool usage. In doing so, you’ll be able to see which agents are good at using which tools, who navigates the tool/resource most efficiently, who does the least amount of rework (measured by screen behavior), and more.
Every person has something they’re good at and something at which they could improve. The key is to identify where these strengths and weaknesses exist, and use them to inform the entire group.
Creating a Culture of Transparency
People are usually quite self aware when it comes to recognizing what they’re good at and what they struggle with at work. The benefit of surfacing the data, recognizing agents for their good work, is that you can create a culture where people are willing and able to talk about their own strengths and weaknesses, and be open to feedback that helps them to improve.
Many orgs focus solely on metrics that are zero-sum, or overly competitive, and in doing so, create a negative culture of competition, causing agents to be reluctant to ask for help or admit where they are struggling.
The more you can help create a culture where you’re highlighting what people are good at, offering support to those who are struggling, and having even your top performers be vulnerable to their peers about where they’re looking to improve, the more your team will be willing to identify where they can improve.
Conclusion
Everyone needs help on something. By using data to recognize top performers, foster peer-to-peer learning, and create a culture of transparency, you are equipping your team to own and drive their own success in their work.
– Alec (?)
Benchmarks and Approaches for Managing Team Engagement // 12 Dec 2019
Realistically, operations agents can’t spend 100% of their time on case work. Between breaks, team meetings, 1-on-1s, training, and more, a lot of things chip away at the 8 hours in any given work day.
So, what are acceptable benchmarks for how much time agents should be spending on case work, versus other things?
Many industry benchmarks suggest that your team should aim for an engagement rate of 80%. While that’s more realistic than aiming for 100%, it’s probably only possible for a small set of teams. If your team relies heavily on continuous learning or is always adapting to new processes, for example, your engagement rate will look different than that of a team whose knowledge base is well established up front and requires little to no iteration or re-training.
This article offers two main approaches for how to think about managing agent engagement: top-down, and bottom-up.
A Top-Down Approach to Target Engagement
A top down approach looks at the sum of all available agent hours, subtracts the necessary time for things like breaks and meetings, and sets a target engagement rate based on assumptions of what is rational, achievable, and good for the business.
For example, imagine you are deciding how long agent-manager 1-on-1 coaching sessions should be. The difference between an hour long meeting and a 30 minute meeting, on the margin, is not huge. When you add that up over a year, however, it ends up being a significant time cost.
Or, maybe you decide to design a tool that integrates agent education directly into the agents’ primary workflow tool. In-context learning can be a great way to disseminate training information, and will, by some measures, increase the percentage of agent time engaged on ‘case work,’ but it may not necessarily give you the real boost in productivity you are hoping to gain. If it’s less efficient, it’s less efficient, regardless of where the materials live.
The 80% engagement goal may be achievable in a week where nothing special is happening, but as soon as you introduce a new process, a new start class of agents, a broken tool, spiky demand, etc, that 80% goal becomes less realistic and harder to reach.
It’s important to set team-wide goals, but it’s also critical to make sure you’re thoughtfully allocating agent time and setting realistic expectations for what the breakdown of hours should look like on a given day, week, or month.
A Bottom-Up Approach from Measuring Engagement
The second approach for managing agent engagement looks from the bottom up. Rather than looking at team-wide averages and aggregate rollups, this approach benchmarks individuals against one another, and examines the variance within agent distributions.
In analyzing where agent time is going at the individual level, you can understand, on a given team, of a given tenure, the distribution of how much time agents are spending on case work versus other work. The goal then becomes to drive down variance.
Almost certainly, when you look bottom-up by person, you’re going to see a much wider variance in performance than you would expect. If you see that some agents’ engagement looks vastly different than others, it’s worth a conversation to understand what the expectations are, who is exceeding them, who is meeting them, and what the goal should be, at the individual level.
Every team is different, from the workflows, to the tool stack, to the people on the team. This bottom-up approach takes into account that complexity, which can be difficult to see from the top-down, and instead asks what a team is achieving not on average, but in the distribution. This data can then inform the types of goals to set in order to drive down the variation and set more realistic expectations for time spent on case work.
Conclusion
As an operations leader, you need to be thoughtful in both the top-down and bottom-up approaches when setting expectations for agent engagement. Ask, at a global level, what numbers are both healthy and achievable goals for your team, as well as on the distribution level, how can you drive down variance across agents. Having the data to give you a clear view from both perspectives will allow you to be scientific in your approach to both.
– Alec (?)
- That’s all for the fin.com blog archive. Return to top
Can’t find an answer?
- Submit a new question.